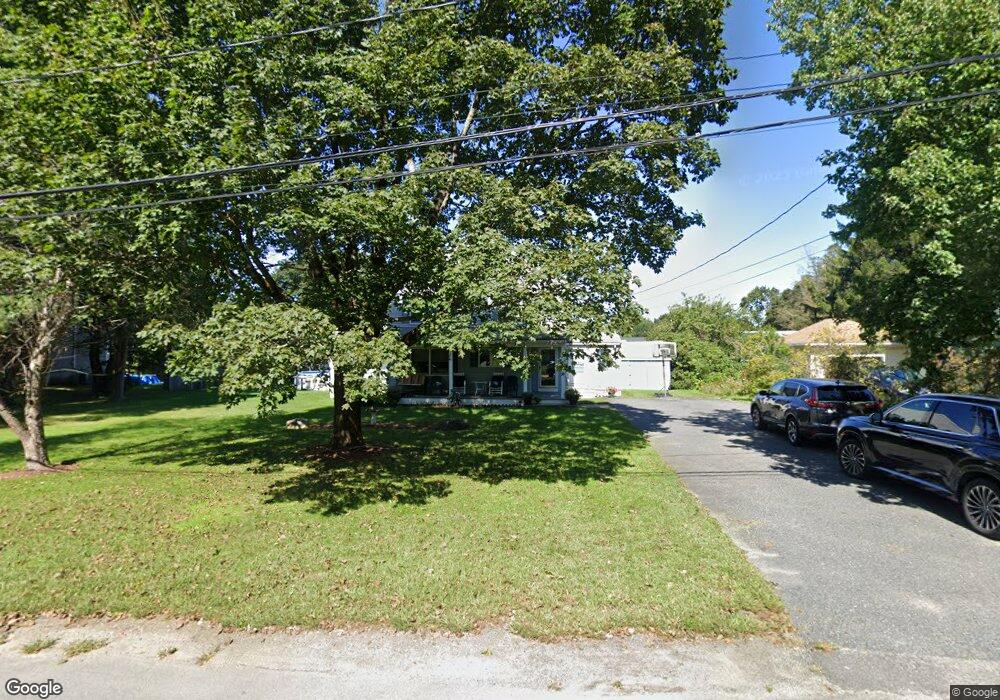
18 Oakview Ave Millis, MA 02054
Estimated Value: $633,000 - $783,000
5
Beds
2
Baths
2,468
Sq Ft
$292/Sq Ft
Est. Value
About This Home
This home is located at 18 Oakview Ave, Millis, MA 02054 and is currently estimated at $720,031, approximately $291 per square foot. 18 Oakview Ave is a home located in Norfolk County with nearby schools including Clyde F Brown, Millis Middle School, and Millis High School.
Ownership History
Date
Name
Owned For
Owner Type
Purchase Details
Closed on
Jul 2, 1992
Sold by
Fed Natl Mtg Assn
Bought by
Fallon Paul C and Fallon Susan
Current Estimated Value
Purchase Details
Closed on
Apr 6, 1992
Sold by
Est Giannetti Denise A
Bought by
Loan Amer Fina Corp
Purchase Details
Closed on
Dec 26, 1990
Sold by
Duffy Peter G
Bought by
Giannetti Denise A
Create a Home Valuation Report for This Property
The Home Valuation Report is an in-depth analysis detailing your home's value as well as a comparison with similar homes in the area
Home Values in the Area
Average Home Value in this Area
Purchase History
| Date | Buyer | Sale Price | Title Company |
|---|---|---|---|
| Fallon Paul C | $107,000 | -- | |
| Loan Amer Fina Corp | $128,916 | -- | |
| Giannetti Denise A | $135,000 | -- |
Source: Public Records
Mortgage History
| Date | Status | Borrower | Loan Amount |
|---|---|---|---|
| Open | Giannetti Denise A | $97,300 | |
| Closed | Giannetti Denise A | $117,000 | |
| Closed | Giannetti Denise A | $2,755 |
Source: Public Records
Tax History
| Year | Tax Paid | Tax Assessment Tax Assessment Total Assessment is a certain percentage of the fair market value that is determined by local assessors to be the total taxable value of land and additions on the property. | Land | Improvement |
|---|---|---|---|---|
| 2025 | $9,722 | $592,800 | $235,300 | $357,500 |
| 2024 | $9,023 | $549,500 | $217,200 | $332,300 |
| 2023 | $8,084 | $462,200 | $173,100 | $289,100 |
| 2022 | $9,323 | $493,800 | $185,700 | $308,100 |
| 2021 | $8,182 | $417,000 | $160,500 | $256,500 |
| 2020 | $8,187 | $406,500 | $150,000 | $256,500 |
| 2019 | $7,362 | $393,700 | $137,200 | $256,500 |
| 2018 | $7,094 | $393,700 | $137,200 | $256,500 |
| 2017 | $6,373 | $346,000 | $117,900 | $228,100 |
| 2016 | $6,034 | $346,000 | $117,900 | $228,100 |
| 2015 | $5,953 | $350,200 | $117,900 | $232,300 |
Source: Public Records
Map
Nearby Homes
- 28 Key St Unit 28
- 6 Rosenfeld Rd
- 324 Union St Unit 1
- 22 May Rd
- 6 April Way
- 10 April Way
- 11 Parnell St
- 6 Rivendell Ln
- 20 Hemlock Cir
- 25 Bayberry Cir Unit 25
- 6 Beech St
- 4 Brookview Rd
- 64 Village St
- 119 Middlesex St
- 33 Spencer St
- 50 Walnut St
- 14 Teresa Dr
- 13 Teresa Dr
- 2 Towne Lyne Rd
- 6 Glen Ellen Blvd Unit 6
Your Personal Tour Guide
Ask me questions while you tour the home.