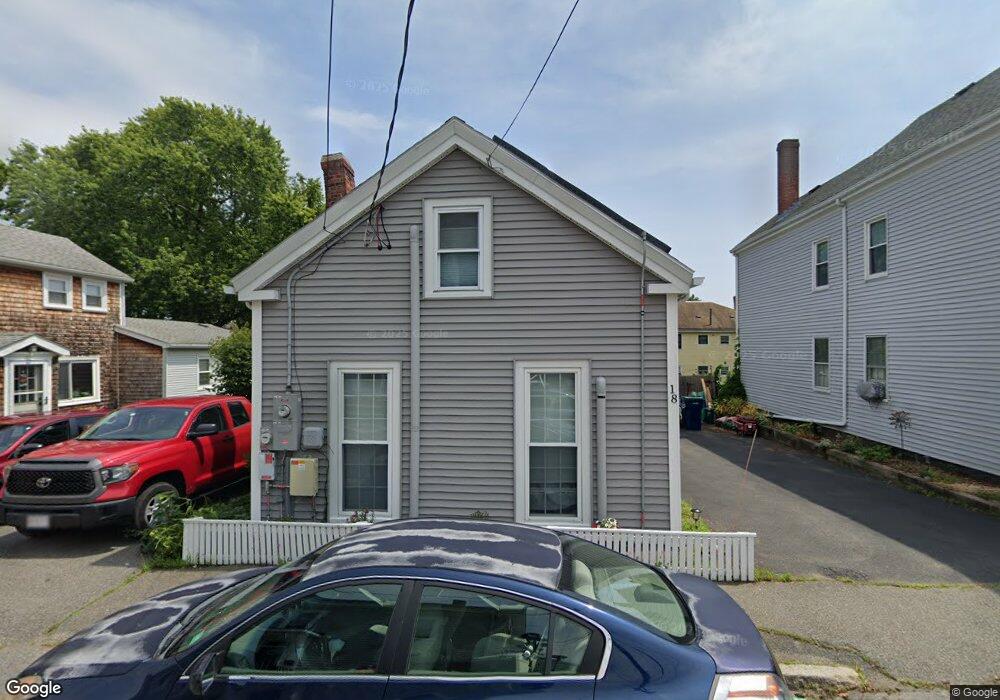
18 Osborne St Salem, MA 01970
North Salem NeighborhoodEstimated Value: $580,000 - $751,000
4
Beds
1
Bath
1,043
Sq Ft
$614/Sq Ft
Est. Value
About This Home
This home is located at 18 Osborne St, Salem, MA 01970 and is currently estimated at $640,814, approximately $614 per square foot. 18 Osborne St is a home located in Essex County with nearby schools including Bates Elementary School, Saltonstall School, and Carlton Elementary School.
Ownership History
Date
Name
Owned For
Owner Type
Purchase Details
Closed on
Oct 5, 2021
Sold by
Burge Wendy and Pelletier Scott
Bought by
W D & Scott Pelletier Lt
Current Estimated Value
Purchase Details
Closed on
Jun 27, 2002
Sold by
Nolan Ronald E and Nolan Elaine R
Bought by
Pelletier Scott and Burge Wendy
Purchase Details
Closed on
Oct 18, 1995
Sold by
Martin Walter Est
Bought by
Nolan Ronald E and Nolan Elaine R
Create a Home Valuation Report for This Property
The Home Valuation Report is an in-depth analysis detailing your home's value as well as a comparison with similar homes in the area
Home Values in the Area
Average Home Value in this Area
Purchase History
| Date | Buyer | Sale Price | Title Company |
|---|---|---|---|
| W D & Scott Pelletier Lt | -- | None Available | |
| Pelletier Scott | $230,000 | -- | |
| Nolan Ronald E | $38,000 | -- | |
| Noland Ronald | $38,000 | -- |
Source: Public Records
Mortgage History
| Date | Status | Borrower | Loan Amount |
|---|---|---|---|
| Previous Owner | Noland Ronald | $36,000 | |
| Previous Owner | Noland Ronald | $171,626 | |
| Previous Owner | Noland Ronald | $190,000 |
Source: Public Records
Tax History Compared to Growth
Tax History
| Year | Tax Paid | Tax Assessment Tax Assessment Total Assessment is a certain percentage of the fair market value that is determined by local assessors to be the total taxable value of land and additions on the property. | Land | Improvement |
|---|---|---|---|---|
| 2025 | $5,698 | $502,500 | $167,600 | $334,900 |
| 2024 | $5,508 | $474,000 | $158,800 | $315,200 |
| 2023 | $5,338 | $426,700 | $147,000 | $279,700 |
| 2022 | $5,065 | $382,300 | $138,200 | $244,100 |
| 2021 | $5,125 | $371,400 | $138,200 | $233,200 |
| 2020 | $4,715 | $326,300 | $119,400 | $206,900 |
| 2019 | $4,696 | $311,000 | $113,500 | $197,500 |
| 2018 | $4,557 | $296,300 | $108,200 | $188,100 |
| 2017 | $4,212 | $265,600 | $88,200 | $177,400 |
| 2016 | $4,032 | $257,300 | $83,500 | $173,800 |
| 2015 | $3,784 | $230,600 | $75,300 | $155,300 |
Source: Public Records
Map
Nearby Homes
- 112 North St
- 8 Upham St
- 18 Franklin St Unit 303
- 3 S Mason St
- 78 Federal St
- 41 Dearborn St
- 47 Federal St
- 5 Larchmont Rd Unit 3
- 0 Lot 41 Map 10 Unit 73335079
- 0 Lot 61 Map 10 Unit 73335091
- 15 Lynde St Unit 26
- 27 Appleton St
- 304 Essex St Unit 1
- 289 Essex St Unit 307
- 156 Bridge St Unit B
- 11 Summer St
- 140 Washington St Unit 1C
- 8 Williams St Unit 2
- 145 Federal St Unit 3
- 20 Central St Unit 402
- 20 Osborne St
- 16 Osborne St
- 17 Foster St
- 17 Foster St Unit 2
- 22 Osborne St
- 14 Osborne St Unit 2
- 14 Osborne St Unit 1
- 14 Osborne St Unit 14 Osborne
- 21 Foster St
- 12 Osborne St Unit 2
- 12 Osborne St Unit 1
- 12 Osborne St
- 12 1/2 Osborne St Unit 1
- 12 1/2-14 Osborne St Unit 2
- 1 Upham St
- 11 Foster St
- 23 Osborne St
- 9 Osborne St
- 10 Osborne St
- 10 Osborne St Unit 1