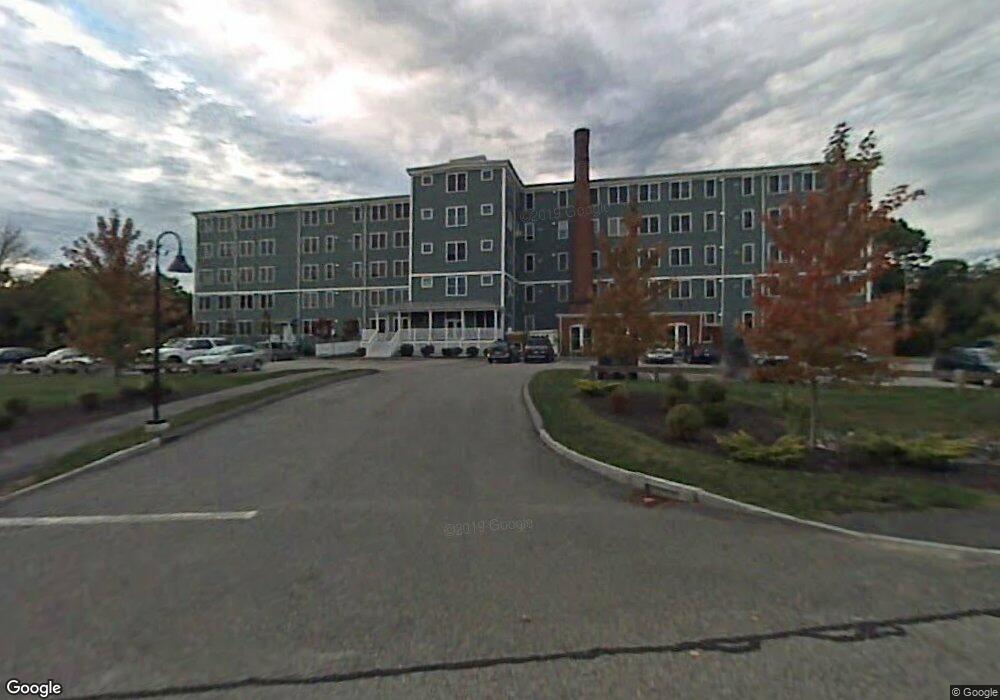
18 Park St Unit 404 Saco, ME 04072
Central Saco NeighborhoodEstimated Value: $354,000 - $420,000
2
Beds
1
Bath
1,500
Sq Ft
$258/Sq Ft
Est. Value
About This Home
This home is located at 18 Park St Unit 404, Saco, ME 04072 and is currently estimated at $387,629, approximately $258 per square foot. 18 Park St Unit 404 is a home located in York County with nearby schools including C K Burns School, Saco Middle School, and Saint James School.
Ownership History
Date
Name
Owned For
Owner Type
Purchase Details
Closed on
May 25, 2016
Sold by
Atherton Marc
Bought by
Bottalico Mauro P and Zhou Lin
Current Estimated Value
Purchase Details
Closed on
Jun 1, 2010
Sold by
Mancini Mark V and Mancini Carol
Bought by
Atherton Marc
Home Financials for this Owner
Home Financials are based on the most recent Mortgage that was taken out on this home.
Original Mortgage
$178,762
Interest Rate
5.13%
Mortgage Type
FHA
Purchase Details
Closed on
Jul 7, 2005
Sold by
Random Orbit Inc
Bought by
Mancini Mark and Arsenault Carol
Home Financials for this Owner
Home Financials are based on the most recent Mortgage that was taken out on this home.
Original Mortgage
$170,100
Interest Rate
5.71%
Mortgage Type
Unknown
Create a Home Valuation Report for This Property
The Home Valuation Report is an in-depth analysis detailing your home's value as well as a comparison with similar homes in the area
Home Values in the Area
Average Home Value in this Area
Purchase History
| Date | Buyer | Sale Price | Title Company |
|---|---|---|---|
| Bottalico Mauro P | -- | -- | |
| Atherton Marc | $175,000 | -- | |
| Mancini Mark | -- | -- |
Source: Public Records
Mortgage History
| Date | Status | Borrower | Loan Amount |
|---|---|---|---|
| Previous Owner | Atherton Marc | $178,762 | |
| Previous Owner | Mancini Mark | $170,100 |
Source: Public Records
Tax History Compared to Growth
Tax History
| Year | Tax Paid | Tax Assessment Tax Assessment Total Assessment is a certain percentage of the fair market value that is determined by local assessors to be the total taxable value of land and additions on the property. | Land | Improvement |
|---|---|---|---|---|
| 2024 | $3,281 | $233,500 | $71,100 | $162,400 |
| 2023 | $3,444 | $233,500 | $71,100 | $162,400 |
| 2022 | $3,090 | $168,600 | $54,200 | $114,400 |
| 2021 | $2,972 | $157,400 | $50,300 | $107,100 |
| 2020 | $2,732 | $138,900 | $42,600 | $96,300 |
| 2019 | $2,692 | $138,900 | $42,600 | $96,300 |
| 2018 | $2,616 | $135,000 | $38,700 | $96,300 |
| 2017 | $2,835 | $146,300 | $38,700 | $107,600 |
| 2016 | $2,684 | $138,200 | $30,600 | $107,600 |
| 2015 | $2,656 | $138,200 | $30,600 | $107,600 |
| 2014 | $2,573 | $138,200 | $30,600 | $107,600 |
| 2013 | -- | $138,200 | $30,600 | $107,600 |
Source: Public Records
Map
Nearby Homes
- 32 Park St
- 91 Bradley St
- 00 Sawyer St
- 104 Hill St Unit 1
- 24 Dyer St
- 4 Westward Ln
- 117 Temple St
- 143 Pleasant St
- 24 Roebuck Ave
- 18 Therrien Ave
- 52 Maple St
- 11 Brentwood Cir
- 372 Main St Unit 201
- 9 Cross St
- 12 Shadagee Rd
- 6 Maple St
- 20 Village Green Dr
- 242 Lincoln St
- 26 Upper Falls Rd Unit 107
- 26 Upper Falls Rd Unit 108
- 18 Park St Unit 507
- 18 Park St Unit 506
- 18 Park St Unit 505
- 18 Park St Unit 504
- 18 Park St Unit 503
- 18 Park St Unit 502
- 18 Park St Unit 501
- 18 Park St Unit 407
- 18 Park St Unit 406
- 18 Park St Unit 405
- 18 Park St Unit 403
- 18 Park St Unit 402
- 18 Park St Unit 401
- 18 Park St Unit 306
- 18 Park St Unit 305
- 18 Park St Unit 304
- 18 Park St Unit 303
- 18 Park St Unit 302
- 18 Park St Unit 301
- 18 Park St Unit 207