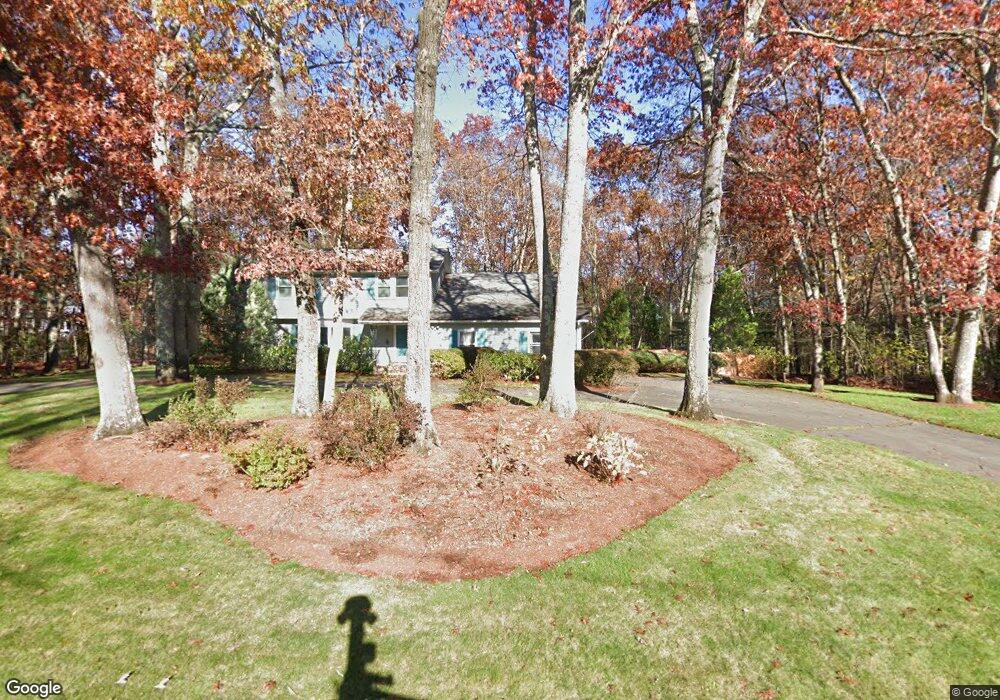
18 Partridge Ln Sudbury, MA 01776
Estimated Value: $983,000 - $1,115,000
4
Beds
3
Baths
2,222
Sq Ft
$470/Sq Ft
Est. Value
About This Home
This home is located at 18 Partridge Ln, Sudbury, MA 01776 and is currently estimated at $1,043,235, approximately $469 per square foot. 18 Partridge Ln is a home located in Middlesex County with nearby schools including Peter Noyes Elementary School, Ephraim Curtis Middle School, and Lincoln-Sudbury Regional High School.
Ownership History
Date
Name
Owned For
Owner Type
Purchase Details
Closed on
Oct 27, 1995
Sold by
Pickert Scott and Pickert Elizabeth H
Bought by
Mcgrath Kevin M and Mcgrath Anne M
Current Estimated Value
Home Financials for this Owner
Home Financials are based on the most recent Mortgage that was taken out on this home.
Original Mortgage
$280,000
Outstanding Balance
$3,917
Interest Rate
7.6%
Mortgage Type
Purchase Money Mortgage
Estimated Equity
$1,039,318
Purchase Details
Closed on
Jul 16, 1993
Sold by
Pitt Aldo M and Pit Constance
Bought by
Pickert Scott and Pickert Elizabeth
Home Financials for this Owner
Home Financials are based on the most recent Mortgage that was taken out on this home.
Original Mortgage
$250,000
Interest Rate
7.4%
Mortgage Type
Purchase Money Mortgage
Create a Home Valuation Report for This Property
The Home Valuation Report is an in-depth analysis detailing your home's value as well as a comparison with similar homes in the area
Home Values in the Area
Average Home Value in this Area
Purchase History
| Date | Buyer | Sale Price | Title Company |
|---|---|---|---|
| Mcgrath Kevin M | $360,000 | -- | |
| Mcgrath Kevin M | $360,000 | -- | |
| Pickert Scott | $336,500 | -- | |
| Pickert Scott | $336,500 | -- |
Source: Public Records
Mortgage History
| Date | Status | Borrower | Loan Amount |
|---|---|---|---|
| Open | Pickert Scott | $280,000 | |
| Closed | Pickert Scott | $280,000 | |
| Previous Owner | Pickert Scott | $250,000 |
Source: Public Records
Tax History Compared to Growth
Tax History
| Year | Tax Paid | Tax Assessment Tax Assessment Total Assessment is a certain percentage of the fair market value that is determined by local assessors to be the total taxable value of land and additions on the property. | Land | Improvement |
|---|---|---|---|---|
| 2025 | $12,965 | $885,600 | $461,300 | $424,300 |
| 2024 | $12,492 | $855,000 | $447,700 | $407,300 |
| 2023 | $11,944 | $757,400 | $414,500 | $342,900 |
| 2022 | $12,110 | $670,900 | $380,100 | $290,800 |
| 2021 | $11,812 | $627,300 | $380,100 | $247,200 |
| 2020 | $11,574 | $627,300 | $380,100 | $247,200 |
| 2019 | $11,235 | $627,300 | $380,100 | $247,200 |
| 2018 | $11,251 | $627,500 | $400,100 | $227,400 |
| 2017 | $11,011 | $620,700 | $395,300 | $225,400 |
| 2016 | $10,673 | $599,600 | $380,100 | $219,500 |
| 2015 | $10,222 | $580,800 | $365,300 | $215,500 |
| 2014 | $10,207 | $566,100 | $354,500 | $211,600 |
Source: Public Records
Map
Nearby Homes
- 21 Summer St
- 7 Saddle Ridge Rd
- 143 Peakham Rd
- 123 Dutton Rd
- 47 Fairbank Rd
- 788 Main St
- 30 Rolling Ln
- 786 Main St
- 10 Shoreline Dr Unit 12
- 8 Shoreline Dr Unit 11
- 14 Old County Rd Unit 21
- 4 Elderberry Cir
- 3 Shore Line Dr Unit 15
- 12 Hickory Rd
- 10 Old County Rd Unit 19
- 1 Town Line Rd
- 1 Town Line Rd Unit 18
- 54 Stone Rd
- Stockbridge South Shore Plan at Lakemont by Toll Brothers
- 12 Town Line Rd Unit 6