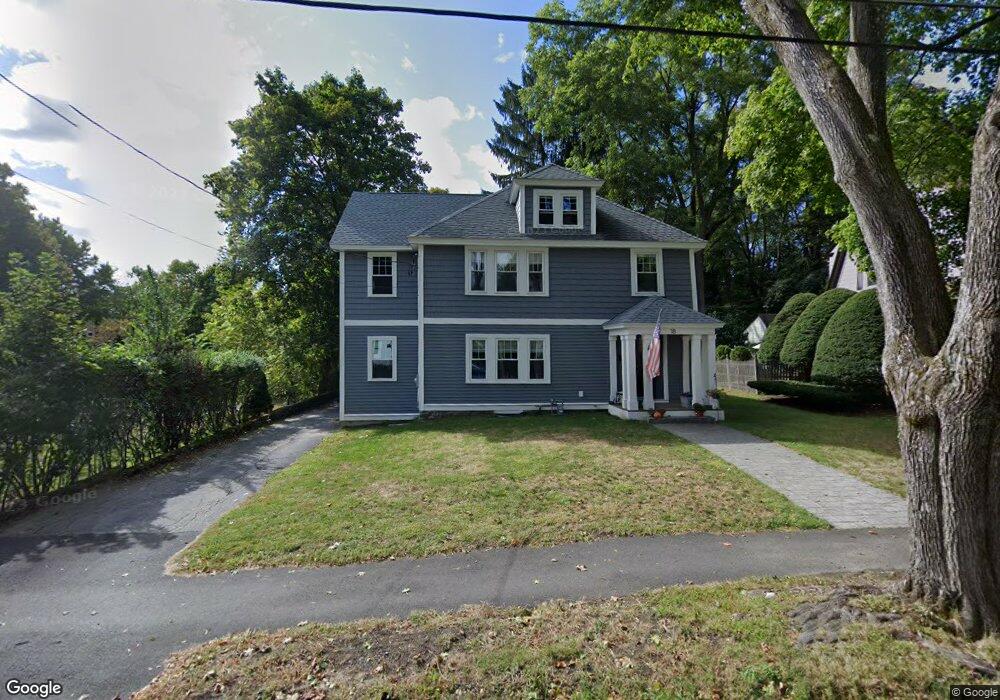
18 Pasho St Andover, MA 01810
East Andover NeighborhoodEstimated Value: $887,000 - $933,000
3
Beds
1
Bath
1,980
Sq Ft
$458/Sq Ft
Est. Value
About This Home
This home is located at 18 Pasho St, Andover, MA 01810 and is currently estimated at $907,373, approximately $458 per square foot. 18 Pasho St is a home located in Essex County with nearby schools including Bancroft Elementary School, Doherty Middle School, and Andover High School.
Ownership History
Date
Name
Owned For
Owner Type
Purchase Details
Closed on
Aug 14, 2009
Sold by
Spinney Rt and Perrone
Bought by
Duval Gregory and Duval Stacy L
Current Estimated Value
Home Financials for this Owner
Home Financials are based on the most recent Mortgage that was taken out on this home.
Original Mortgage
$270,000
Interest Rate
5.36%
Mortgage Type
Purchase Money Mortgage
Purchase Details
Closed on
Feb 15, 2007
Sold by
Spinney Donald
Bought by
Spinney Rt and Perone
Create a Home Valuation Report for This Property
The Home Valuation Report is an in-depth analysis detailing your home's value as well as a comparison with similar homes in the area
Home Values in the Area
Average Home Value in this Area
Purchase History
We collect this data history from publicly available records. To have your information removed, we recommend requesting removal directly through your county’s website.
| Date | Buyer | Sale Price | Title Company |
|---|---|---|---|
| Duval Gregory | $300,000 | -- | |
| Duval Gregory R | $300,000 | -- | |
| Duval Gregory R | $300,000 | -- | |
| Spinney Rt | -- | -- | |
| Spinney Rt | -- | -- | |
| Spinney Rt | -- | -- |
Source: Public Records
Mortgage History
We collect this data history from publicly available records. To have your information removed, we recommend requesting removal directly through your county’s website.
| Date | Status | Borrower | Loan Amount |
|---|---|---|---|
| Open | Spinney Rt | $291,200 | |
| Closed | Duval Gregory R | $270,000 |
Source: Public Records
Tax History
| Year | Tax Paid | Tax Assessment Tax Assessment Total Assessment is a certain percentage of the fair market value that is determined by local assessors to be the total taxable value of land and additions on the property. | Land | Improvement |
|---|---|---|---|---|
| 2025 | $10,418 | $834,100 | $506,000 | $328,100 |
| 2024 | $10,044 | $779,800 | $463,600 | $316,200 |
| 2023 | $9,584 | $701,600 | $417,500 | $284,100 |
| 2022 | $9,081 | $622,000 | $369,600 | $252,400 |
| 2021 | $8,666 | $566,800 | $335,900 | $230,900 |
| 2020 | $8,307 | $553,400 | $327,800 | $225,600 |
| 2019 | $7,649 | $500,900 | $315,000 | $185,900 |
| 2018 | $7,559 | $483,300 | $297,100 | $186,200 |
| 2017 | $7,223 | $475,800 | $291,200 | $184,600 |
| 2016 | $7,051 | $475,800 | $291,200 | $184,600 |
| 2015 | $6,792 | $453,700 | $280,100 | $173,600 |
Source: Public Records
Map
Nearby Homes
- 9 Stratford Rd
- 31 Pine St
- 33 Chestnut St Unit 2
- 9 Elm Ct
- 10 Elm Ct
- 8 Chestnut St
- 4 Applecrest Rd
- 31 School St Unit 1
- 12 Burton Farm Dr
- 1 Rogers Brook E
- 156 Elm St
- 2 Powder Mill Square Unit 2B
- 16R High St
- 2 Brechin Terrace
- 324 Hillside Rd
- 11 Cuba St
- 20 Washington Park Dr Unit 12
- 70 Washington Park Dr Unit 6
- 80 B Washington Park Dr Unit 7
- 49 Salem St
Your Personal Tour Guide
Ask me questions while you tour the home.