18 Pine Ave Trenton, GA 30752
Estimated Value: $219,000 - $271,000
3
Beds
2
Baths
1,826
Sq Ft
$129/Sq Ft
Est. Value
About This Home
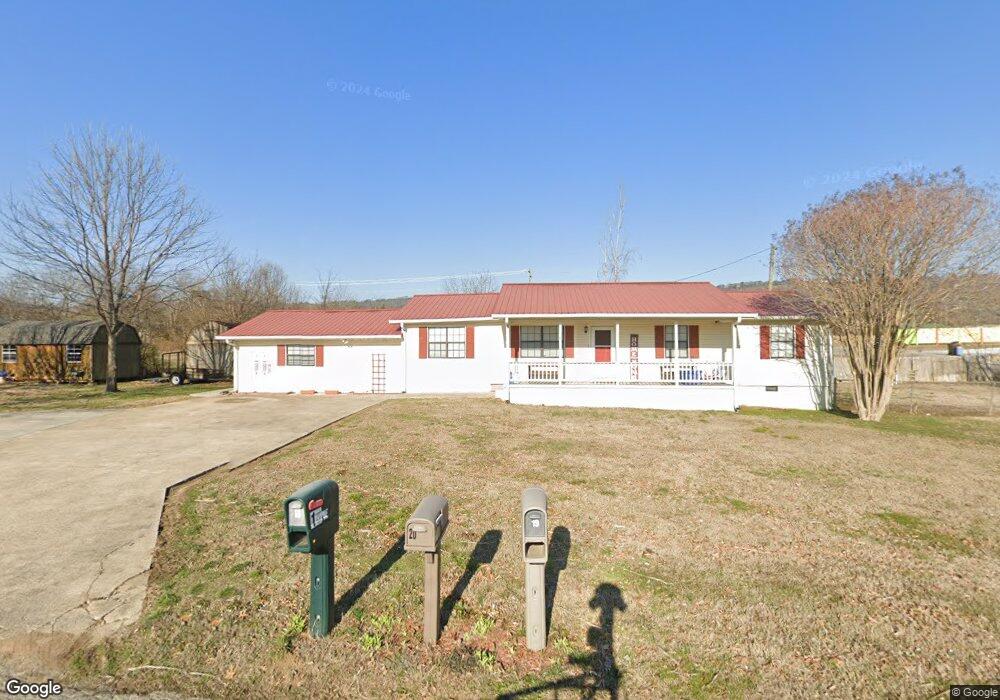
This home is located at 18 Pine Ave, Trenton, GA 30752 and is currently estimated at $235,591, approximately $129 per square foot. 18 Pine Ave is a home located in Dade County with nearby schools including Dade Middle School and Dade County High School.
Ownership History
Date
Name
Owned For
Owner Type
Purchase Details
Closed on
Mar 13, 2015
Sold by
Eastman Sally
Bought by
Smith John D and Smith Kelly E
Current Estimated Value
Home Financials for this Owner
Home Financials are based on the most recent Mortgage that was taken out on this home.
Original Mortgage
$96,000
Outstanding Balance
$73,399
Interest Rate
3.87%
Mortgage Type
New Conventional
Estimated Equity
$162,192
Purchase Details
Closed on
Oct 26, 2010
Sold by
Federal Home Loan Mortgage Corporation
Bought by
Eastman Sally
Purchase Details
Closed on
Jun 1, 2010
Sold by
Suntrust Mortgage Inc
Bought by
Federal Home Loan Mortgage Corporation
Purchase Details
Closed on
Jul 21, 2000
Sold by
Phillips John P And
Bought by
Petty Jackie Ernest
Purchase Details
Closed on
Oct 3, 1996
Sold by
John Crabtree
Bought by
Phillips John P And
Purchase Details
Closed on
Oct 29, 1993
Sold by
Crabtree Johnny And
Create a Home Valuation Report for This Property
The Home Valuation Report is an in-depth analysis detailing your home's value as well as a comparison with similar homes in the area
Home Values in the Area
Average Home Value in this Area
Purchase History
| Date | Buyer | Sale Price | Title Company |
|---|---|---|---|
| Smith John D | $120,000 | -- | |
| Eastman Sally | $67,000 | -- | |
| Federal Home Loan Mortgage Corporation | $74,387 | -- | |
| Suntrust Mortgage Inc | $74,387 | -- | |
| Federal Home Loan Mortgage Corp | $74,387 | -- | |
| Suntrust Mortgage Inc | $74,387 | -- | |
| Petty Jackie Ernest | $75,000 | -- | |
| Phillips John P And | $62,000 | -- | |
| -- | $6,500 | -- |
Source: Public Records
Mortgage History
| Date | Status | Borrower | Loan Amount |
|---|---|---|---|
| Open | Smith John D | $96,000 |
Source: Public Records
Tax History
| Year | Tax Paid | Tax Assessment Tax Assessment Total Assessment is a certain percentage of the fair market value that is determined by local assessors to be the total taxable value of land and additions on the property. | Land | Improvement |
|---|---|---|---|---|
| 2025 | $2,208 | $79,632 | $15,000 | $64,632 |
| 2024 | $2,160 | $75,232 | $9,000 | $66,232 |
| 2023 | $1,842 | $73,312 | $9,000 | $64,312 |
| 2022 | $1,796 | $72,552 | $9,000 | $63,552 |
| 2021 | $1,559 | $62,044 | $6,000 | $56,044 |
| 2020 | $1,529 | $58,524 | $4,480 | $54,044 |
| 2019 | $1,481 | $56,364 | $4,480 | $51,884 |
| 2018 | $1,484 | $56,364 | $4,480 | $51,884 |
| 2017 | $1,261 | $47,884 | $4,480 | $43,404 |
| 2016 | $1,253 | $47,884 | $4,480 | $43,404 |
| 2015 | $1,219 | $47,884 | $4,480 | $43,404 |
| 2014 | -- | $52,444 | $6,000 | $46,444 |
| 2013 | -- | $49,404 | $6,000 | $43,404 |
Source: Public Records
Map
Nearby Homes
- 132 Edgewood St
- 0 Georgia 136
- 259 Bernice Dr
- 730 Sells Ln
- 134 Melissa Dr
- 11080 U S 11
- 294 N Woods Ln
- 19 May Ave
- 272 Cherokee Trail
- 42 Case Cir
- 128 Williams St
- 165 N Woods Ln
- 61 Lake Dr
- 0 Northwoods Ln Unit 1521613
- 553 Back Valley Rd
- 10 Tanglewood Trail
- 54 Whispering Pine
- 70 Pinoak Rd
- 000 W Ga 136 Hwy
- 494 Canyon Park Dr
Your Personal Tour Guide
Ask me questions while you tour the home.