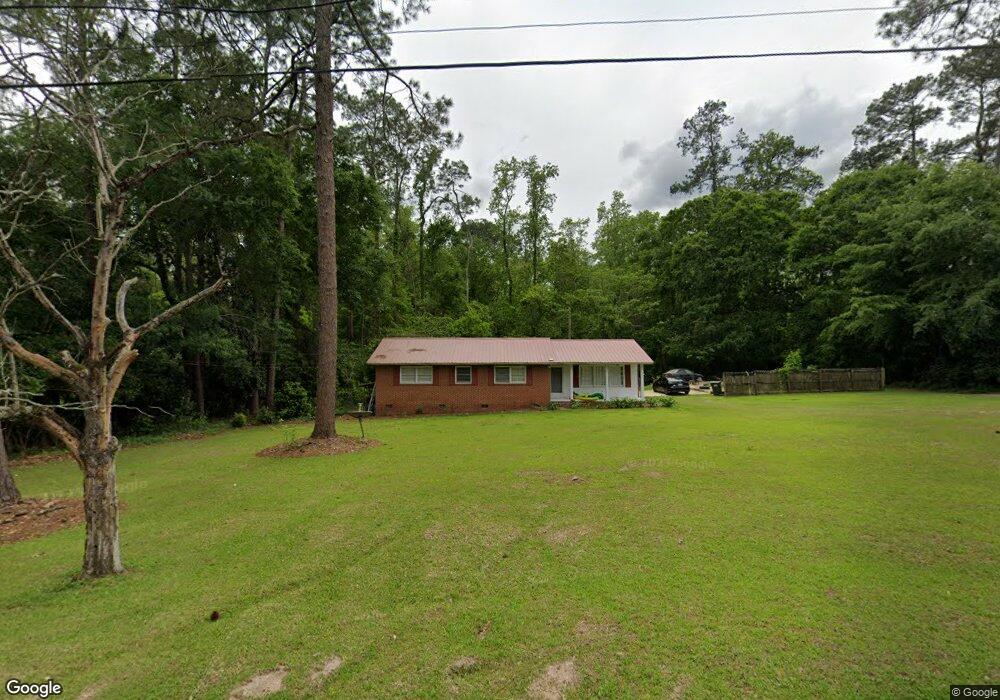
18 Pine Valley Cir Moultrie, GA 31768
Estimated Value: $149,000 - $202,000
3
Beds
2
Baths
1,540
Sq Ft
$116/Sq Ft
Est. Value
About This Home
This home is located at 18 Pine Valley Cir, Moultrie, GA 31768 and is currently estimated at $179,091, approximately $116 per square foot. 18 Pine Valley Cir is a home located in Colquitt County with nearby schools including Wright Elementary School, Willie J. Williams Middle School, and C.A. Gray Junior High School.
Ownership History
Date
Name
Owned For
Owner Type
Purchase Details
Closed on
Aug 29, 2018
Sold by
Wilminton Savings Fund Society Fsb Trust
Bought by
Bautista Fernando
Current Estimated Value
Purchase Details
Closed on
Nov 6, 2017
Sold by
Teifer Melanie
Bought by
Wilminton Savings Fund Society
Purchase Details
Closed on
Dec 2, 2005
Sold by
Teifer Garey
Bought by
Teifer Garey and Teifer Melanie O
Home Financials for this Owner
Home Financials are based on the most recent Mortgage that was taken out on this home.
Original Mortgage
$78,000
Interest Rate
9.15%
Mortgage Type
New Conventional
Purchase Details
Closed on
Nov 5, 1992
Bought by
Eure Melanie O
Purchase Details
Closed on
May 11, 1992
Bought by
Fitzgerald Scott S
Create a Home Valuation Report for This Property
The Home Valuation Report is an in-depth analysis detailing your home's value as well as a comparison with similar homes in the area
Home Values in the Area
Average Home Value in this Area
Purchase History
| Date | Buyer | Sale Price | Title Company |
|---|---|---|---|
| Bautista Fernando | $70,000 | -- | |
| Wilminton Savings Fund Society | $84,121 | -- | |
| Teifer Garey | -- | -- | |
| Teifer Gary | -- | -- | |
| Eure Melanie O | $50,000 | -- | |
| Fitzgerald Scott S | -- | -- |
Source: Public Records
Mortgage History
| Date | Status | Borrower | Loan Amount |
|---|---|---|---|
| Previous Owner | Teifer Gary | $78,000 |
Source: Public Records
Tax History Compared to Growth
Tax History
| Year | Tax Paid | Tax Assessment Tax Assessment Total Assessment is a certain percentage of the fair market value that is determined by local assessors to be the total taxable value of land and additions on the property. | Land | Improvement |
|---|---|---|---|---|
| 2024 | $1,748 | $62,201 | $6,720 | $55,481 |
| 2023 | $1,878 | $41,997 | $6,720 | $35,277 |
| 2022 | $1,270 | $37,945 | $6,720 | $31,225 |
| 2021 | $1,252 | $36,932 | $6,720 | $30,212 |
| 2020 | $1,193 | $34,610 | $6,720 | $27,890 |
| 2019 | $1,087 | $33,061 | $6,720 | $26,341 |
| 2018 | $1,320 | $33,061 | $6,720 | $26,341 |
| 2017 | $1,296 | $35,223 | $6,720 | $28,503 |
| 2016 | $1,352 | $35,223 | $6,720 | $28,503 |
| 2015 | $1,356 | $35,223 | $6,720 | $28,503 |
| 2014 | $1,388 | $35,223 | $6,720 | $28,503 |
| 2013 | -- | $35,223 | $6,720 | $28,503 |
Source: Public Records
Map
Nearby Homes
- 0 Gatewood Cir Unit 1652303
- 1712 Villa Dr SW
- 905 Barbara Cir
- 904 Barbara Cir
- 1546 Ivy Ln
- 1777 S Main St
- 29 17th Ave SE
- 1310 S Main St
- 1941 S Main St
- 1175 4th St SW
- 304 Tallokas Rd
- 0 Georgia 33
- 1160 4th St SW
- 1159 6th St SW
- 1215 12th St SW
- 210 13th Ave SE
- 2021 S Main St
- 1732 4th St SE
- 1935 4th St SE
- 1904 5th St SE
- 16 Pine Valley Cir
- 22 Pine Valley Cir
- 14 Pine Valley Cir
- 120 Loblolly Rd
- 1800 Pine Cir
- 9 Pine Valley Cir
- 3 Woodridge Rd
- 11 Pine Valley Cir
- 126 Loblolly Rd
- 1725 Pine Cir
- 13 Pine Valley Cir
- 12 Pine Valley Cir
- 7 Pine Valley Cir
- 15 Pine Valley Circle Dr SW
- 116 Loblolly Rd
- 118 Loblolly Rd
- 28 Pine Valley Cir
- 1719 Pine Cir
- 119 Loblolly Rd
- 127 Loblolly Rd