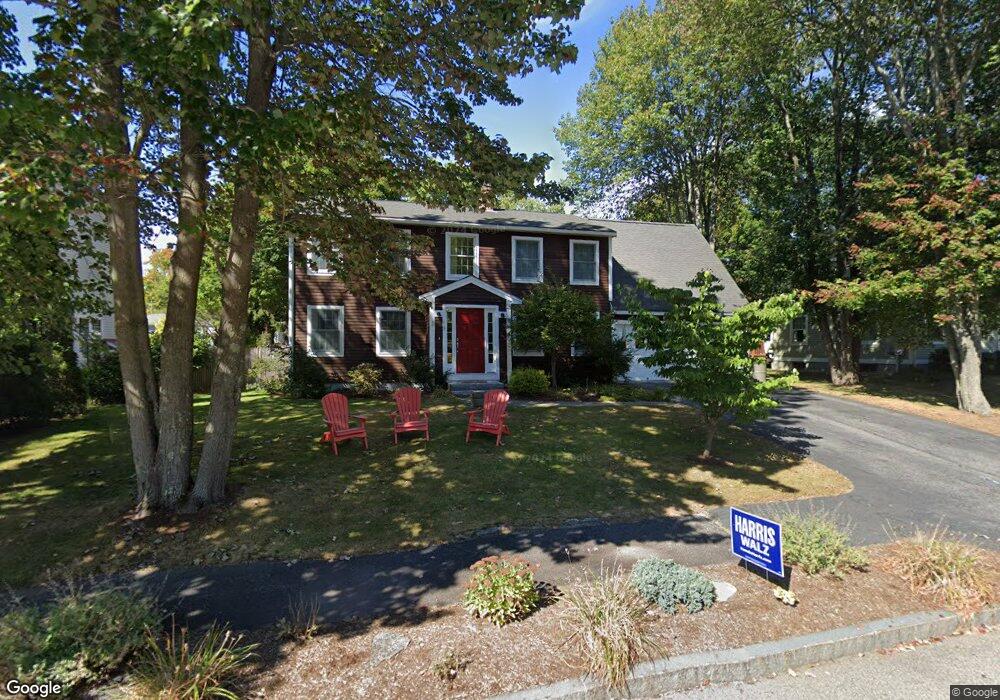
18 Rabbit Run Portland, ME 04102
Rosemont NeighborhoodEstimated Value: $778,000 - $845,000
4
Beds
3
Baths
2,578
Sq Ft
$316/Sq Ft
Est. Value
About This Home
This home is located at 18 Rabbit Run, Portland, ME 04102 and is currently estimated at $813,815, approximately $315 per square foot. 18 Rabbit Run is a home located in Cumberland County with nearby schools including Amanda C Rowe School, King Middle School, and Levey Day School.
Ownership History
Date
Name
Owned For
Owner Type
Purchase Details
Closed on
Jul 30, 2008
Sold by
Blethen Robert C and Blethen Catherine S
Bought by
Tenenbaum Andrew J and Tenenbaum Debra L
Current Estimated Value
Home Financials for this Owner
Home Financials are based on the most recent Mortgage that was taken out on this home.
Original Mortgage
$321,200
Interest Rate
6.47%
Mortgage Type
Unknown
Create a Home Valuation Report for This Property
The Home Valuation Report is an in-depth analysis detailing your home's value as well as a comparison with similar homes in the area
Home Values in the Area
Average Home Value in this Area
Purchase History
| Date | Buyer | Sale Price | Title Company |
|---|---|---|---|
| Tenenbaum Andrew J | -- | -- |
Source: Public Records
Mortgage History
| Date | Status | Borrower | Loan Amount |
|---|---|---|---|
| Open | Tenenbaum Andrew J | $299,500 | |
| Closed | Tenenbaum Andrew J | $304,000 | |
| Closed | Tenenbaum Andrew J | $321,200 |
Source: Public Records
Tax History Compared to Growth
Tax History
| Year | Tax Paid | Tax Assessment Tax Assessment Total Assessment is a certain percentage of the fair market value that is determined by local assessors to be the total taxable value of land and additions on the property. | Land | Improvement |
|---|---|---|---|---|
| 2024 | $8,173 | $544,500 | $83,000 | $461,500 |
| 2023 | $7,846 | $544,500 | $83,000 | $461,500 |
| 2022 | $7,411 | $544,500 | $83,000 | $461,500 |
| 2021 | $7,073 | $544,500 | $83,000 | $461,500 |
| 2020 | $8,207 | $352,100 | $90,000 | $262,100 |
| 2019 | $8,207 | $352,100 | $90,000 | $262,100 |
| 2018 | $7,915 | $352,100 | $90,000 | $262,100 |
| 2017 | $7,623 | $352,100 | $90,000 | $262,100 |
| 2016 | $7,433 | $352,100 | $90,000 | $262,100 |
| 2015 | $7,264 | $352,100 | $90,000 | $262,100 |
| 2014 | $6,738 | $336,900 | $90,000 | $246,900 |
Source: Public Records
Map
Nearby Homes
- 1542 Congress St
- 7 Twin Knolls Ln
- 159 Bancroft St
- 18 Stoneledge Dr
- 4 Fairview St
- 162 Hobart St
- 24 Edwards St
- 160 Craigie St
- 63A Capisic St
- 1346 Westbrook St
- 89 Cobb Ave
- 6 Highland St
- 296 Brighton Ave
- 200 Massachusetts Ave
- 232 Brighton Ave
- 1 Firefly St Unit 402
- 1 Firefly St Unit 201
- 1 Firefly St Unit 303
- 1 Firefly St Unit 302
- 1 Firefly St Unit 403/103