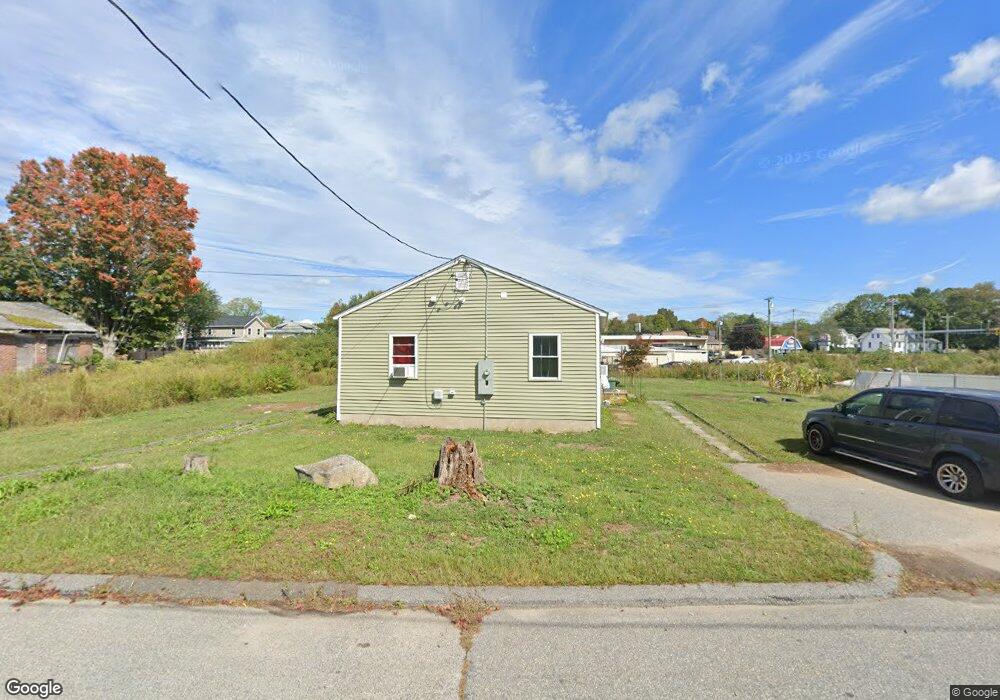
18 Raleigh Ct Groton, CT 06340
Poquonock Bridge NeighborhoodEstimated Value: $214,000 - $273,000
3
Beds
1
Bath
825
Sq Ft
$298/Sq Ft
Est. Value
About This Home
This home is located at 18 Raleigh Ct, Groton, CT 06340 and is currently estimated at $245,667, approximately $297 per square foot. 18 Raleigh Ct is a home located in New London County with nearby schools including Claude Chester School, Groton Middle School, and Robert E. Fitch High School.
Ownership History
Date
Name
Owned For
Owner Type
Purchase Details
Closed on
Nov 1, 2022
Sold by
Hood Shipman Llc
Bought by
Sancho Jose and Ortega Rosa
Current Estimated Value
Home Financials for this Owner
Home Financials are based on the most recent Mortgage that was taken out on this home.
Original Mortgage
$1,115,000
Outstanding Balance
$993,497
Interest Rate
6.7%
Mortgage Type
Purchase Money Mortgage
Estimated Equity
-$747,830
Create a Home Valuation Report for This Property
The Home Valuation Report is an in-depth analysis detailing your home's value as well as a comparison with similar homes in the area
Home Values in the Area
Average Home Value in this Area
Purchase History
| Date | Buyer | Sale Price | Title Company |
|---|---|---|---|
| Sancho Jose | $844,000 | None Available | |
| Sancho Jose | $844,000 | None Available |
Source: Public Records
Mortgage History
| Date | Status | Borrower | Loan Amount |
|---|---|---|---|
| Open | Sancho Jose | $1,115,000 | |
| Closed | Sancho Jose | $1,115,000 |
Source: Public Records
Tax History Compared to Growth
Tax History
| Year | Tax Paid | Tax Assessment Tax Assessment Total Assessment is a certain percentage of the fair market value that is determined by local assessors to be the total taxable value of land and additions on the property. | Land | Improvement |
|---|---|---|---|---|
| 2025 | $2,400 | $81,340 | $42,238 | $39,102 |
| 2024 | $2,281 | $82,110 | $43,008 | $39,102 |
| 2023 | $2,236 | $82,110 | $26,250 | $55,860 |
| 2022 | $2,184 | $82,110 | $26,250 | $55,860 |
| 2021 | $1,857 | $57,190 | $29,190 | $28,000 |
| 2020 | $1,808 | $57,190 | $29,190 | $28,000 |
| 2019 | $1,741 | $57,190 | $29,190 | $28,000 |
| 2018 | $1,724 | $57,190 | $29,190 | $28,000 |
| 2017 | $1,679 | $57,190 | $29,190 | $28,000 |
| 2016 | $2,052 | $73,080 | $45,150 | $27,930 |
| 2015 | $1,973 | $73,080 | $45,150 | $27,930 |
| 2014 | $1,921 | $73,080 | $45,150 | $27,930 |
Source: Public Records
Map
Nearby Homes