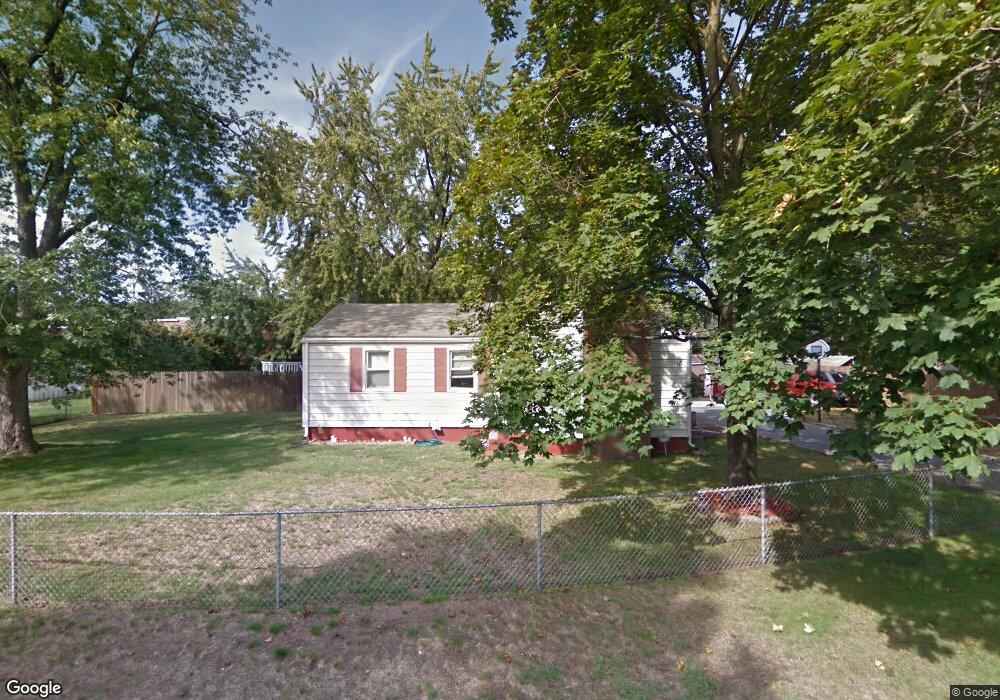
18 Redfern Dr Springfield, MA 01109
Pine Point NeighborhoodEstimated Value: $252,000 - $265,000
3
Beds
1
Bath
955
Sq Ft
$271/Sq Ft
Est. Value
About This Home
This home is located at 18 Redfern Dr, Springfield, MA 01109 and is currently estimated at $259,175, approximately $271 per square foot. 18 Redfern Dr is a home located in Hampden County with nearby schools including Hiram L. Dorman Elementary, John F. Kennedy Academy, and Springfield Central High School.
Ownership History
Date
Name
Owned For
Owner Type
Purchase Details
Closed on
Jul 14, 1999
Sold by
Killian William J and Killian Joan C
Bought by
Candanedo-Cortes Zaida and Cortes Armando
Current Estimated Value
Home Financials for this Owner
Home Financials are based on the most recent Mortgage that was taken out on this home.
Original Mortgage
$74,386
Outstanding Balance
$18,990
Interest Rate
7.39%
Mortgage Type
Purchase Money Mortgage
Estimated Equity
$240,185
Create a Home Valuation Report for This Property
The Home Valuation Report is an in-depth analysis detailing your home's value as well as a comparison with similar homes in the area
Home Values in the Area
Average Home Value in this Area
Purchase History
| Date | Buyer | Sale Price | Title Company |
|---|---|---|---|
| Candanedo-Cortes Zaida | $75,000 | -- |
Source: Public Records
Mortgage History
| Date | Status | Borrower | Loan Amount |
|---|---|---|---|
| Open | Candanedo-Cortes Zaida | $74,386 |
Source: Public Records
Tax History
| Year | Tax Paid | Tax Assessment Tax Assessment Total Assessment is a certain percentage of the fair market value that is determined by local assessors to be the total taxable value of land and additions on the property. | Land | Improvement |
|---|---|---|---|---|
| 2025 | $3,047 | $194,300 | $39,900 | $154,400 |
| 2024 | $3,243 | $201,900 | $39,900 | $162,000 |
| 2023 | $2,985 | $175,100 | $35,300 | $139,800 |
| 2022 | $2,983 | $158,500 | $33,000 | $125,500 |
| 2021 | $2,691 | $142,400 | $30,000 | $112,400 |
| 2020 | $2,445 | $125,200 | $30,000 | $95,200 |
| 2019 | $2,308 | $117,300 | $31,000 | $86,300 |
| 2018 | $2,188 | $111,200 | $31,000 | $80,200 |
| 2017 | $2,227 | $113,300 | $34,200 | $79,100 |
| 2016 | $2,117 | $107,700 | $34,200 | $73,500 |
| 2015 | $2,115 | $107,500 | $34,200 | $73,300 |
Source: Public Records
Map
Nearby Homes
Your Personal Tour Guide
Ask me questions while you tour the home.