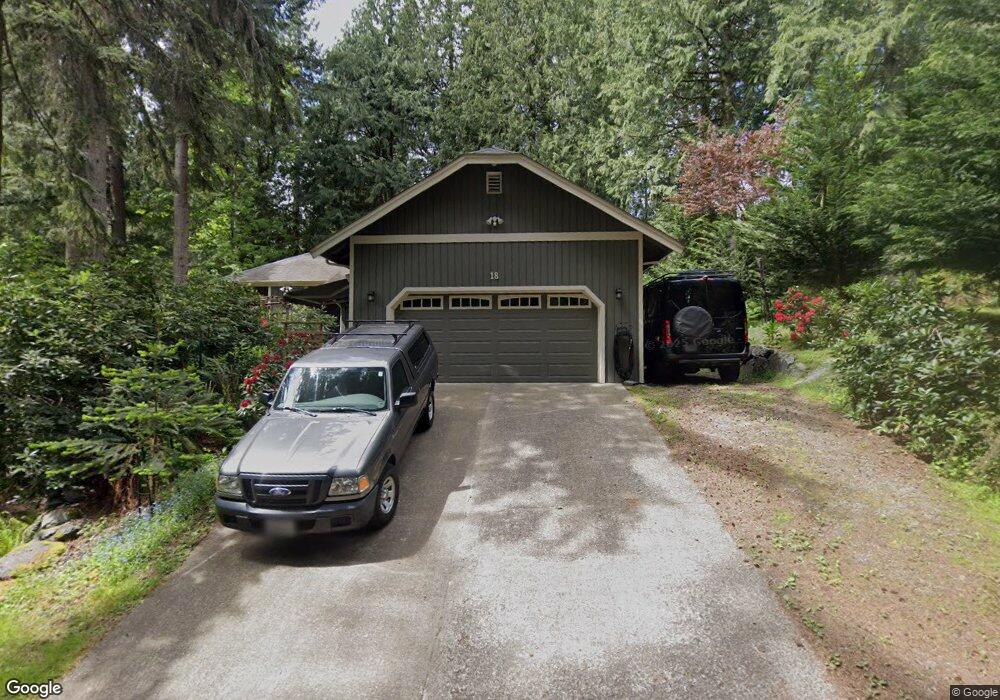
18 Ridge Crest Way Bellingham, WA 98229
Estimated Value: $452,000 - $608,000
3
Beds
2
Baths
1,450
Sq Ft
$361/Sq Ft
Est. Value
About This Home
This home is located at 18 Ridge Crest Way, Bellingham, WA 98229 and is currently estimated at $524,022, approximately $361 per square foot. 18 Ridge Crest Way is a home located in Whatcom County with nearby schools including Geneva Elementary School, Kulshan Middle School, and Bellingham High School.
Ownership History
Date
Name
Owned For
Owner Type
Purchase Details
Closed on
Aug 12, 2010
Sold by
Barth Charlene M
Bought by
Carlsen Russell A
Current Estimated Value
Home Financials for this Owner
Home Financials are based on the most recent Mortgage that was taken out on this home.
Original Mortgage
$233,458
Outstanding Balance
$153,634
Interest Rate
4.45%
Mortgage Type
VA
Estimated Equity
$370,388
Purchase Details
Closed on
Feb 4, 2009
Sold by
Residential Funding Real Estate Holdings
Bought by
Shumway Ladd H and Shumway Paige E
Purchase Details
Closed on
Nov 26, 2008
Sold by
Mistal Allen
Bought by
Residential Funding Real Estate Holdings
Purchase Details
Closed on
Apr 11, 2000
Sold by
Pasquan Rudolph
Bought by
Maris William J and Maris Paula
Create a Home Valuation Report for This Property
The Home Valuation Report is an in-depth analysis detailing your home's value as well as a comparison with similar homes in the area
Home Values in the Area
Average Home Value in this Area
Purchase History
| Date | Buyer | Sale Price | Title Company |
|---|---|---|---|
| Carlsen Russell A | $226,280 | Chicago Title Insurance | |
| Shumway Ladd H | $148,280 | First American Title Ins | |
| Residential Funding Real Estate Holdings | $143,954 | First American Title Ins | |
| Maris William J | -- | Whatcom Land Title |
Source: Public Records
Mortgage History
| Date | Status | Borrower | Loan Amount |
|---|---|---|---|
| Open | Carlsen Russell A | $233,458 |
Source: Public Records
Tax History Compared to Growth
Tax History
| Year | Tax Paid | Tax Assessment Tax Assessment Total Assessment is a certain percentage of the fair market value that is determined by local assessors to be the total taxable value of land and additions on the property. | Land | Improvement |
|---|---|---|---|---|
| 2024 | $4,325 | $495,506 | $168,650 | $326,856 |
| 2023 | $4,325 | $498,532 | $169,680 | $328,852 |
| 2022 | $3,445 | $429,781 | $146,280 | $283,501 |
| 2021 | $3,303 | $311,435 | $106,000 | $205,435 |
| 2020 | $3,319 | $293,807 | $100,000 | $193,807 |
| 2019 | $3,037 | $293,038 | $86,304 | $206,734 |
| 2018 | $3,047 | $275,139 | $81,000 | $194,139 |
| 2017 | $2,573 | $235,118 | $69,188 | $165,930 |
| 2016 | $2,309 | $206,815 | $60,750 | $146,065 |
| 2015 | $2,312 | $194,235 | $57,904 | $136,331 |
| 2014 | -- | $188,687 | $56,250 | $132,437 |
| 2013 | -- | $170,912 | $65,700 | $105,212 |
Source: Public Records
Map
Nearby Homes
- 63 Valley Crest Way
- 19 Valley Crest Way
- 434 Sudden Valley Dr
- 422 Sudden Valley Dr
- 3 Acorn Place
- 1 Valley Crest Way
- 43 Rocky Ridge Dr
- 2 Marigold Dr Unit 26
- 2 Marigold Dr Unit 36
- 15 Wintercress Way
- 337 Sudden Valley Dr
- 76B Sudden Valley Dr
- 21 Clematis Ln
- 8 Morning Glory Dr
- 7 Deer Run Ln
- 63 Louise View Dr
- 36 Holly View Way
- 1 Lake Louise Dr Unit 42
- 5 Shetland Ct
- 8 Shetland Ct
- 22 Ridge Crest Way
- 14 Ridge Crest Way
- 15 Ridge Crest Way
- 9 Ridge Crest Way
- 21 Rocky Ridge Dr
- 12 Ridge Crest Way
- 23 Rocky Ridge Dr
- 24 Ridge Crest Way
- 25 Rocky Ridge Dr
- 24 Valley Crest Way
- 8 Ridge Crest Way
- 20 Valley Crest Way
- 27 Rocky Ridge Dr
- 10 Ridge Crest Way
- 7 Ridge Crest Way
- 18 Valley Crest Way
- 19 Rocky Ridge Dr
- 26 Valley Crest Way
- 62 Valley Crest Way
- 24 Rocky Ridge Dr