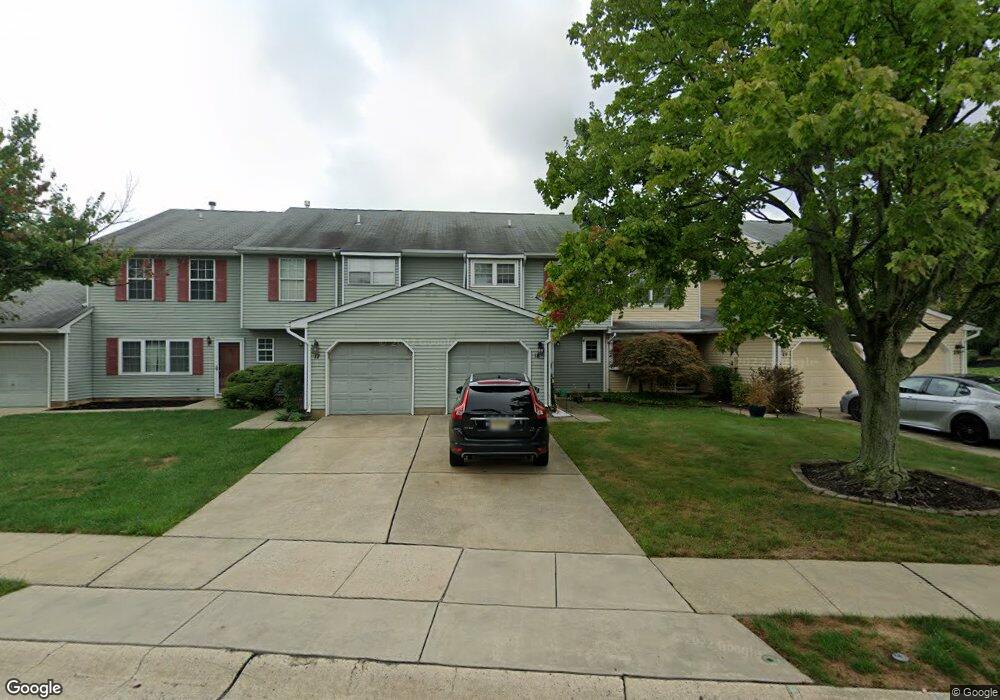
18 Roanoke Ct Unit 22337 Bordentown, NJ 08505
Estimated Value: $366,000 - $397,000
--
Bed
--
Bath
1,526
Sq Ft
$247/Sq Ft
Est. Value
About This Home
This home is located at 18 Roanoke Ct Unit 22337, Bordentown, NJ 08505 and is currently estimated at $376,925, approximately $247 per square foot. 18 Roanoke Ct Unit 22337 is a home located in Burlington County with nearby schools including Bordentown Reg High School and Meadow View Junior Academy.
Ownership History
Date
Name
Owned For
Owner Type
Purchase Details
Closed on
Nov 30, 2007
Sold by
Dauber Michael G and Dauber Sharon H
Bought by
Dauber William Pasqual
Current Estimated Value
Home Financials for this Owner
Home Financials are based on the most recent Mortgage that was taken out on this home.
Original Mortgage
$244,649
Outstanding Balance
$154,853
Interest Rate
6.3%
Mortgage Type
VA
Estimated Equity
$222,072
Purchase Details
Closed on
Feb 10, 2000
Sold by
Lytkowski John D and Roth Lytkowski Stacey P
Bought by
Dauber Michael G and Dauber Sharon H
Home Financials for this Owner
Home Financials are based on the most recent Mortgage that was taken out on this home.
Original Mortgage
$111,180
Interest Rate
8.11%
Mortgage Type
VA
Create a Home Valuation Report for This Property
The Home Valuation Report is an in-depth analysis detailing your home's value as well as a comparison with similar homes in the area
Home Values in the Area
Average Home Value in this Area
Purchase History
| Date | Buyer | Sale Price | Title Company |
|---|---|---|---|
| Dauber William Pasqual | $240,000 | E Land Title Solution | |
| Dauber Michael G | $109,000 | -- |
Source: Public Records
Mortgage History
| Date | Status | Borrower | Loan Amount |
|---|---|---|---|
| Open | Dauber William Pasqual | $244,649 | |
| Previous Owner | Dauber Michael G | $111,180 |
Source: Public Records
Tax History Compared to Growth
Tax History
| Year | Tax Paid | Tax Assessment Tax Assessment Total Assessment is a certain percentage of the fair market value that is determined by local assessors to be the total taxable value of land and additions on the property. | Land | Improvement |
|---|---|---|---|---|
| 2025 | $5,838 | $173,300 | $62,000 | $111,300 |
| 2024 | $5,838 | $173,300 | $62,000 | $111,300 |
| 2023 | $5,838 | $173,300 | $62,000 | $111,300 |
| 2022 | $5,894 | $173,300 | $62,000 | $111,300 |
| 2021 | $6,185 | $173,300 | $62,000 | $111,300 |
| 2020 | $6,176 | $173,300 | $62,000 | $111,300 |
| 2019 | $6,064 | $173,300 | $62,000 | $111,300 |
| 2018 | $5,986 | $173,300 | $62,000 | $111,300 |
| 2017 | $5,800 | $173,300 | $62,000 | $111,300 |
| 2016 | $5,669 | $173,300 | $62,000 | $111,300 |
| 2015 | $5,547 | $173,300 | $62,000 | $111,300 |
| 2014 | $5,298 | $173,300 | $62,000 | $111,300 |
Source: Public Records
Map
Nearby Homes
- 31 Gloucester Ct Unit 22295
- 39 Gloucester Ct
- 14 Tioga Ct Unit 22353
- 26 Exeter Ct Unit 22160
- 3 Exeter Ct Unit 22137
- 6 Delaware Dr
- 26 Kennebec Ct Unit 22
- 35 Farmington Ct
- 15 Wyndham Ct
- 7 Westbury Ct
- 26 Andover Ct
- 6 Sweetbriar Ln
- 310 Hopkinson St
- 12 E Burlington St
- 7 Red Barn Ln
- 402 Prince St
- 418 Willow St
- 365 Prince St
- 51 Mary St
- 101 Walnut St
- 17 Roanoke Ct Unit 22336
- 19 Roanoke Ct Unit 22338
- 16 Roanoke Ct
- 20 Roanoke Ct Unit 22339
- 15 Roanoke Ct
- 14 Roanoke Ct Unit 22333
- 3 Roanoke Ct Unit 22322
- 1 Tioga Ct Unit 22340
- 1 Roanoke Ct
- 2 Roanoke Ct Unit 22321
- 24 Gloucester Ct Unit 22288
- 12 Roanoke Ct Unit 22331
- 4 Roanoke Ct Unit 22323
- 2 Tioga Ct
- 25 Gloucester Ct Unit 22289
- 11 Roanoke Ct Unit 22330
- 11 Roanoke Ct Unit 330
- 3 Tioga Ct Unit 22342
- 9 Roanoke Ct Unit 22328
- 35 Gloucester Ct Unit 22299