Estimated Value: $978,379 - $1,159,000
4
Beds
3
Baths
2,539
Sq Ft
$417/Sq Ft
Est. Value
About This Home
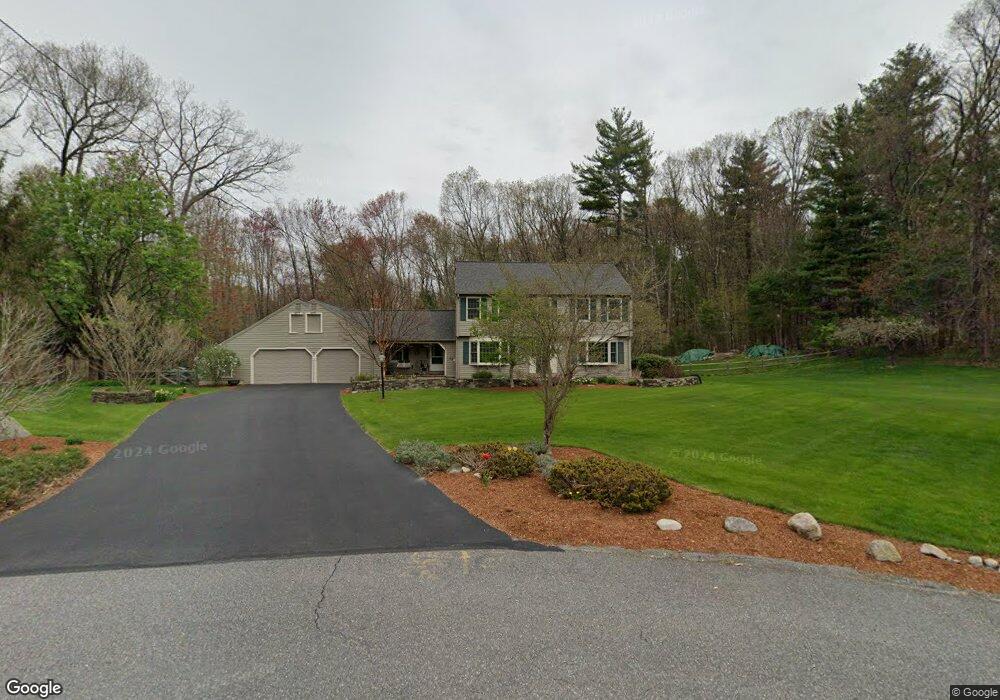
This home is located at 18 Robert Rd, Acton, MA 01720 and is currently estimated at $1,059,595, approximately $417 per square foot. 18 Robert Rd is a home located in Middlesex County with nearby schools including Acton-Boxborough Regional High School, Maynard Knowledge Beginnings, and The Imago School.
Ownership History
Date
Name
Owned For
Owner Type
Purchase Details
Closed on
Sep 19, 2023
Sold by
Howard W Kuenzler Ret and Kuenzler
Bought by
Kuenzler
Current Estimated Value
Purchase Details
Closed on
Aug 24, 2018
Sold by
Kuenzler Howard W and Kuenzler Carole A
Bought by
Howard W Kuenzler Ret and Kuenzler
Purchase Details
Closed on
Sep 12, 1979
Bought by
Kuenzler Howard W
Create a Home Valuation Report for This Property
The Home Valuation Report is an in-depth analysis detailing your home's value as well as a comparison with similar homes in the area
Home Values in the Area
Average Home Value in this Area
Purchase History
| Date | Buyer | Sale Price | Title Company |
|---|---|---|---|
| Kuenzler | -- | None Available | |
| Howard W Kuenzler Ret | -- | -- | |
| Kuenzler Howard W | -- | -- |
Source: Public Records
Mortgage History
| Date | Status | Borrower | Loan Amount |
|---|---|---|---|
| Previous Owner | Kuenzler Howard W | $100,000 | |
| Previous Owner | Kuenzler Howard W | $120,000 |
Source: Public Records
Tax History
| Year | Tax Paid | Tax Assessment Tax Assessment Total Assessment is a certain percentage of the fair market value that is determined by local assessors to be the total taxable value of land and additions on the property. | Land | Improvement |
|---|---|---|---|---|
| 2025 | $15,823 | $922,600 | $372,500 | $550,100 |
| 2024 | $14,841 | $890,300 | $372,500 | $517,800 |
| 2023 | $14,696 | $836,900 | $338,500 | $498,400 |
| 2022 | $13,913 | $715,300 | $295,300 | $420,000 |
| 2021 | $13,566 | $670,600 | $272,900 | $397,700 |
| 2020 | $12,795 | $665,000 | $272,900 | $392,100 |
| 2019 | $12,453 | $642,900 | $272,900 | $370,000 |
| 2018 | $12,233 | $631,200 | $272,900 | $358,300 |
| 2017 | $11,918 | $625,300 | $272,900 | $352,400 |
| 2016 | $11,686 | $607,700 | $272,900 | $334,800 |
| 2015 | $11,708 | $614,600 | $272,900 | $341,700 |
| 2014 | $11,302 | $581,100 | $272,900 | $308,200 |
Source: Public Records
Map
Nearby Homes
- 1 Drummer Rd Unit A5
- 63 Conant St
- 128 Parker St Unit 3B
- 30 Brewster Ln
- 31 Drummer Rd Unit 31
- 36 Brown St
- 70 Powder Mill Rd
- 68 Powder Mill Rd
- 40 High St
- 66 Powder Mill Rd
- 1 Vanderbelt Rd
- 12 Brown St
- 70 River St
- 7 Hillcrest Dr
- 23 Deer Path Unit 5
- 96 Forest Ridge Rd Unit 96
- 129 Main St Unit 129
- 131 Main St
- 22 Douglas Ave Unit 2
- 22 Douglas Ave Unit 1
Your Personal Tour Guide
Ask me questions while you tour the home.