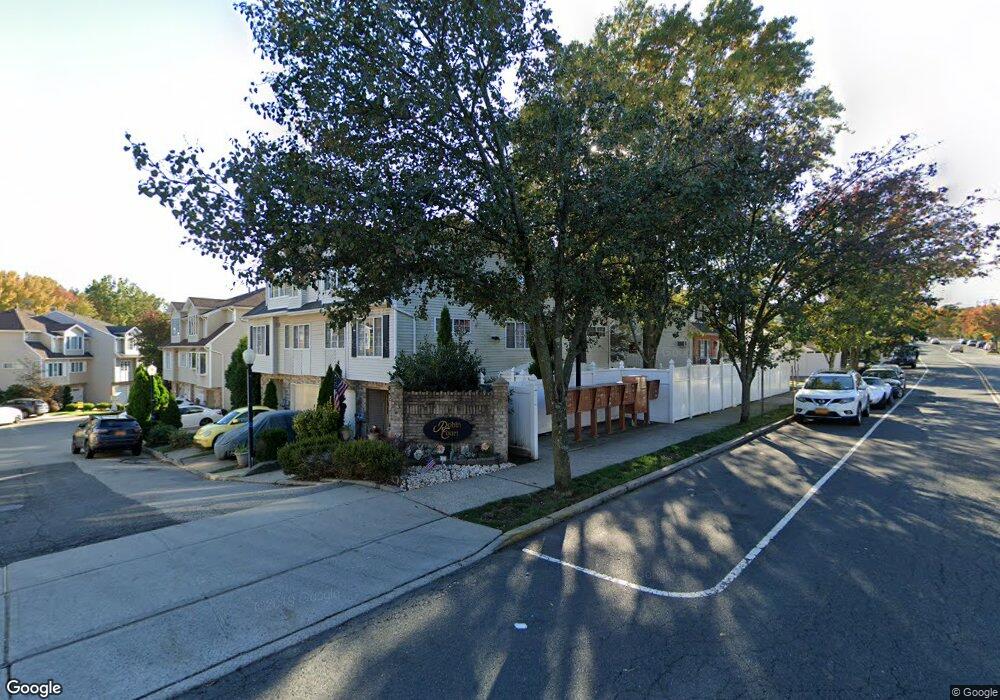
18 Robin Ct Staten Island, NY 10309
Woodrow NeighborhoodEstimated Value: $841,046 - $925,000
4
Beds
3
Baths
2,772
Sq Ft
$317/Sq Ft
Est. Value
About This Home
This home is located at 18 Robin Ct, Staten Island, NY 10309 and is currently estimated at $879,012, approximately $317 per square foot. 18 Robin Ct is a home located in Richmond County with nearby schools including P.S. 6 Cpl Allan F Kivlehan School, Is 34 Tottenville, and Tottenville High School.
Ownership History
Date
Name
Owned For
Owner Type
Purchase Details
Closed on
Mar 29, 2008
Sold by
Torres Carlos R
Bought by
Torres Carlos R and Ramos Jasmin
Current Estimated Value
Purchase Details
Closed on
Sep 25, 1998
Sold by
Rose Allan V
Bought by
Torres Carlos R
Purchase Details
Closed on
May 30, 1995
Sold by
Woodrose Associates
Bought by
Rose Alan V
Create a Home Valuation Report for This Property
The Home Valuation Report is an in-depth analysis detailing your home's value as well as a comparison with similar homes in the area
Home Values in the Area
Average Home Value in this Area
Purchase History
| Date | Buyer | Sale Price | Title Company |
|---|---|---|---|
| Torres Carlos R | -- | Chicago Title Insurance Co | |
| Torres Carlos R | $256,000 | Commonwealth Land Title Ins | |
| Rose Alan V | -- | First American Title Ins Co |
Source: Public Records
Tax History Compared to Growth
Tax History
| Year | Tax Paid | Tax Assessment Tax Assessment Total Assessment is a certain percentage of the fair market value that is determined by local assessors to be the total taxable value of land and additions on the property. | Land | Improvement |
|---|---|---|---|---|
| 2025 | $7,184 | $49,980 | $7,146 | $42,834 |
| 2024 | $7,184 | $45,000 | $7,488 | $37,512 |
| 2023 | $7,265 | $35,770 | $6,976 | $28,794 |
| 2022 | $7,087 | $45,120 | $9,420 | $35,700 |
| 2021 | $7,048 | $40,680 | $9,420 | $31,260 |
| 2020 | $6,688 | $40,740 | $9,420 | $31,320 |
| 2019 | $6,236 | $39,540 | $9,420 | $30,120 |
| 2018 | $6,076 | $29,808 | $8,139 | $21,669 |
| 2017 | $6,030 | $29,583 | $8,063 | $21,520 |
| 2016 | $5,579 | $27,909 | $8,221 | $19,688 |
| 2015 | $4,767 | $26,330 | $6,940 | $19,390 |
| 2014 | $4,767 | $24,840 | $7,860 | $16,980 |
Source: Public Records
Map
Nearby Homes
- 155 Darnell Ln
- 117 Pembrook Loop
- 59 Pembrook Loop
- 50 Mallard Ln
- 45 Pembrook Loop
- 33 White Oak Ln
- 42 Spruce Ln
- 11 Jessica Ln
- 122 Clay Pit Rd
- 23 Sharon Ln
- 55 Quail Ln
- 20 Helene Ct
- 0 Veterans Rd E
- 23 Helene Ct
- 476 Hargold Ave
- 100 Marisa Cir
- 19 Woodrose Ln
- 62 Dexter Ave
- 669 Bloomingdale Rd
- 41 Brookside Loop