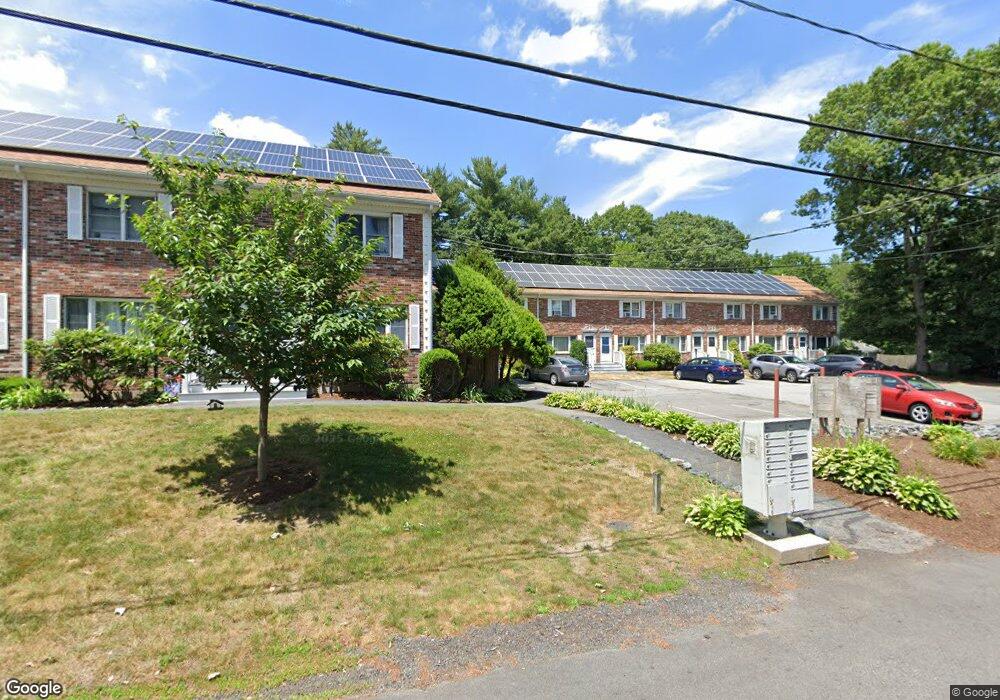
18 Robins St East Bridgewater, MA 02333
Estimated Value: $364,000 - $382,823
2
Beds
2
Baths
1,152
Sq Ft
$327/Sq Ft
Est. Value
About This Home
This home is located at 18 Robins St, East Bridgewater, MA 02333 and is currently estimated at $376,706, approximately $327 per square foot. 18 Robins St is a home located in Plymouth County with nearby schools including Gordon W Mitchell Middle School and East Bridgewater Jr./Sr. High School.
Ownership History
Date
Name
Owned For
Owner Type
Purchase Details
Closed on
Jul 15, 2011
Sold by
Klim James R
Bought by
Klim Ft
Current Estimated Value
Purchase Details
Closed on
Mar 17, 1999
Sold by
Department Of Housing & Urban Dev
Bought by
Klim James R
Home Financials for this Owner
Home Financials are based on the most recent Mortgage that was taken out on this home.
Original Mortgage
$56,159
Interest Rate
6.74%
Mortgage Type
Purchase Money Mortgage
Purchase Details
Closed on
Nov 3, 1998
Sold by
Steven H Moore
Bought by
Ge Capital Mtg Svcs
Purchase Details
Closed on
Feb 1, 1995
Sold by
Mlq Investors Lp
Bought by
Moore Steven H and Moore Donna
Home Financials for this Owner
Home Financials are based on the most recent Mortgage that was taken out on this home.
Original Mortgage
$67,600
Interest Rate
9.13%
Mortgage Type
Purchase Money Mortgage
Purchase Details
Closed on
Mar 28, 1988
Sold by
Robinson Gail A
Bought by
Provost Dennis A
Home Financials for this Owner
Home Financials are based on the most recent Mortgage that was taken out on this home.
Original Mortgage
$90,750
Interest Rate
9.82%
Mortgage Type
Purchase Money Mortgage
Create a Home Valuation Report for This Property
The Home Valuation Report is an in-depth analysis detailing your home's value as well as a comparison with similar homes in the area
Home Values in the Area
Average Home Value in this Area
Purchase History
| Date | Buyer | Sale Price | Title Company |
|---|---|---|---|
| Klim Ft | -- | -- | |
| Klim James R | $81,159 | -- | |
| Ge Capital Mtg Svcs | $84,889 | -- | |
| Moore Steven H | $69,500 | -- | |
| Provost Dennis A | $121,000 | -- |
Source: Public Records
Mortgage History
| Date | Status | Borrower | Loan Amount |
|---|---|---|---|
| Previous Owner | Provost Dennis A | $50,000 | |
| Previous Owner | Provost Dennis A | $56,159 | |
| Previous Owner | Provost Dennis A | $67,600 | |
| Previous Owner | Provost Dennis A | $90,750 |
Source: Public Records
Tax History Compared to Growth
Tax History
| Year | Tax Paid | Tax Assessment Tax Assessment Total Assessment is a certain percentage of the fair market value that is determined by local assessors to be the total taxable value of land and additions on the property. | Land | Improvement |
|---|---|---|---|---|
| 2025 | $4,220 | $308,700 | $0 | $308,700 |
| 2024 | $4,005 | $289,400 | $0 | $289,400 |
| 2023 | $3,760 | $260,200 | $0 | $260,200 |
| 2022 | $3,588 | $230,000 | $0 | $230,000 |
| 2021 | $3,466 | $203,300 | $0 | $203,300 |
| 2020 | $3,430 | $198,400 | $0 | $198,400 |
| 2019 | $3,257 | $185,500 | $0 | $185,500 |
| 2018 | $3,008 | $167,500 | $0 | $167,500 |
| 2017 | $2,716 | $148,400 | $0 | $148,400 |
| 2016 | $2,619 | $144,200 | $0 | $144,200 |
| 2015 | $2,716 | $152,900 | $0 | $152,900 |
| 2014 | $2,604 | $149,900 | $0 | $149,900 |
Source: Public Records
Map
Nearby Homes
- 1 Robins St Unit 1
- 96 Trailwood Dr
- 24 High Pond Dr
- 67 Country Dr
- 23 Stone Meadow Dr
- 1993 Washington St
- 114 Plain St
- 148 Lot 1a Elm St
- 1 Lamppost Dr
- 10 Eliab Latham Way
- Lot 1 Mill St
- 74 Magnolia Way
- 780 Old Plymouth St
- 0 Three Rivers Dr
- 4 Sycamore Ln
- 477 Cherry St
- 2 Lydon Ln Unit A1
- 199 Cherry St
- 865 Plymouth St Unit 865
- 225 Whitman St