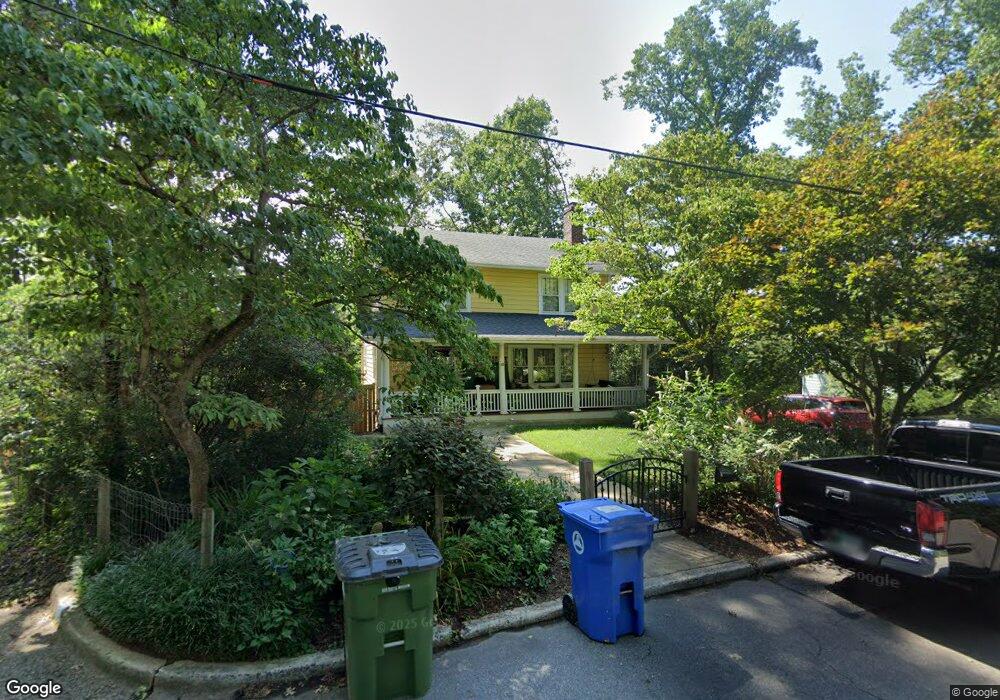
18 Rosewood Ave Asheville, NC 28801
Montford NeighborhoodEstimated Value: $933,000 - $1,154,000
4
Beds
4
Baths
2,568
Sq Ft
$398/Sq Ft
Est. Value
About This Home
This home is located at 18 Rosewood Ave, Asheville, NC 28801 and is currently estimated at $1,023,037, approximately $398 per square foot. 18 Rosewood Ave is a home located in Buncombe County with nearby schools including Isaac Dickson Elementary, Hall Fletcher Elementary, and Ira B Jones Elementary.
Ownership History
Date
Name
Owned For
Owner Type
Purchase Details
Closed on
Sep 3, 2019
Sold by
Adcock Rustan and Patten Sarah Caldwell
Bought by
Caldwell Adcock Rustan and Caldwell Pateen Sarah
Current Estimated Value
Purchase Details
Closed on
May 15, 2003
Sold by
Johnson Steven Lee and Preston Mary F
Bought by
Adcock Rustan O and Patten Sarah C
Home Financials for this Owner
Home Financials are based on the most recent Mortgage that was taken out on this home.
Original Mortgage
$195,000
Outstanding Balance
$84,566
Interest Rate
5.76%
Mortgage Type
Unknown
Estimated Equity
$938,471
Purchase Details
Closed on
Jul 8, 2002
Sold by
Carmichael Charles H and Worrell Mary B
Bought by
Johnson Steven Lee and Preston Mary F
Purchase Details
Closed on
Jan 19, 1996
Sold by
Davison Rosalie B
Bought by
Carmichael and Worrell
Create a Home Valuation Report for This Property
The Home Valuation Report is an in-depth analysis detailing your home's value as well as a comparison with similar homes in the area
Home Values in the Area
Average Home Value in this Area
Purchase History
| Date | Buyer | Sale Price | Title Company |
|---|---|---|---|
| Caldwell Adcock Rustan | -- | None Available | |
| Adcock Rustan O | $265,000 | -- | |
| Johnson Steven Lee | $250,000 | -- | |
| Carmichael | $77,000 | -- |
Source: Public Records
Mortgage History
| Date | Status | Borrower | Loan Amount |
|---|---|---|---|
| Open | Adcock Rustan O | $195,000 |
Source: Public Records
Tax History Compared to Growth
Tax History
| Year | Tax Paid | Tax Assessment Tax Assessment Total Assessment is a certain percentage of the fair market value that is determined by local assessors to be the total taxable value of land and additions on the property. | Land | Improvement |
|---|---|---|---|---|
| 2025 | $7,348 | $711,300 | $172,000 | $539,300 |
| 2024 | $7,348 | $711,300 | $172,000 | $539,300 |
| 2023 | $7,348 | $711,300 | $172,000 | $539,300 |
| 2022 | $7,093 | $711,300 | $0 | $0 |
| 2021 | $7,093 | $711,300 | $0 | $0 |
| 2020 | $7,103 | $659,000 | $0 | $0 |
| 2019 | $7,103 | $659,000 | $0 | $0 |
| 2018 | $7,103 | $659,000 | $0 | $0 |
| 2017 | $7,169 | $324,700 | $0 | $0 |
| 2016 | $3,991 | $324,700 | $0 | $0 |
| 2015 | $3,991 | $324,700 | $0 | $0 |
| 2014 | $3,882 | $319,800 | $0 | $0 |
Source: Public Records
Map
Nearby Homes
- 99999 Gray St
- 57 Rosewood Ave
- 112 Pearson Dr
- 30 Gray St
- 288 Montford Ave
- 44 Watauga St
- 67 Westover Dr
- 51, 51B Westover Dr
- 11 Cullowhee St
- 162 Courtland Place
- 46 Cumberland Cir
- 21 Sylvan Ave
- 177 Cumberland Ave
- 149 Courtland Ave Unit 5
- 231 Westover Dr
- 132 Houston St Unit B
- 99999 Blake St
- 100 West St
- 13 North St
- 84 Elizabeth St