18 Round Table Rd Shrewsbury, MA 01545
Estimated Value: $1,047,655 - $1,247,000
4
Beds
3
Baths
2,674
Sq Ft
$428/Sq Ft
Est. Value
About This Home
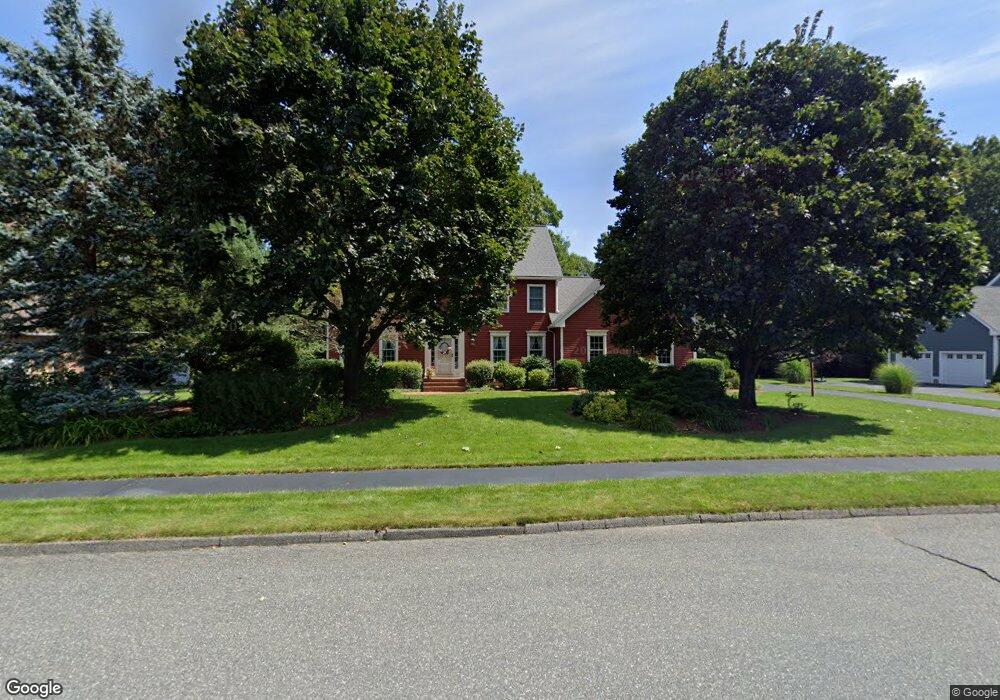
This home is located at 18 Round Table Rd, Shrewsbury, MA 01545 and is currently estimated at $1,145,164, approximately $428 per square foot. 18 Round Table Rd is a home located in Worcester County with nearby schools including Spring Street Elementary School, Sherwood Middle School, and Oak Middle School.
Ownership History
Date
Name
Owned For
Owner Type
Purchase Details
Closed on
Jan 15, 1999
Sold by
Kumming Mark W and Kumming Deborah G
Bought by
Snook David L and Iuster Raluca
Current Estimated Value
Home Financials for this Owner
Home Financials are based on the most recent Mortgage that was taken out on this home.
Original Mortgage
$150,000
Outstanding Balance
$34,612
Interest Rate
6.7%
Mortgage Type
Purchase Money Mortgage
Estimated Equity
$1,110,552
Purchase Details
Closed on
Aug 17, 1995
Sold by
Zerbe Mark W and Seeber Marianne
Bought by
Kumming Mark and Kumming Deborah
Purchase Details
Closed on
Sep 15, 1994
Sold by
C V D Dev Co Inc
Bought by
Zerbe Marc W and Seeber Marianne
Purchase Details
Closed on
Aug 26, 1993
Sold by
Cvd Dev Co Inc
Bought by
Snook David L and Iuster Raluca
Create a Home Valuation Report for This Property
The Home Valuation Report is an in-depth analysis detailing your home's value as well as a comparison with similar homes in the area
Home Values in the Area
Average Home Value in this Area
Purchase History
| Date | Buyer | Sale Price | Title Company |
|---|---|---|---|
| Snook David L | $345,800 | -- | |
| Snook David L | $345,800 | -- | |
| Kumming Mark | $307,000 | -- | |
| Kumming Mark | $307,000 | -- | |
| Zerbe Marc W | $305,400 | -- | |
| Zerbe Marc W | $305,400 | -- | |
| Snook David L | $282,391 | -- |
Source: Public Records
Mortgage History
| Date | Status | Borrower | Loan Amount |
|---|---|---|---|
| Open | Snook David L | $150,000 | |
| Closed | Snook David L | $150,000 | |
| Previous Owner | Snook David L | $25,000 |
Source: Public Records
Tax History Compared to Growth
Tax History
| Year | Tax Paid | Tax Assessment Tax Assessment Total Assessment is a certain percentage of the fair market value that is determined by local assessors to be the total taxable value of land and additions on the property. | Land | Improvement |
|---|---|---|---|---|
| 2025 | $111 | $925,100 | $284,300 | $640,800 |
| 2024 | $11,447 | $924,600 | $270,700 | $653,900 |
| 2023 | $10,710 | $816,300 | $270,700 | $545,600 |
| 2022 | $9,877 | $700,000 | $240,700 | $459,300 |
| 2021 | $8,819 | $668,600 | $240,700 | $427,900 |
| 2020 | $8,384 | $672,300 | $240,700 | $431,600 |
| 2019 | $8,086 | $643,300 | $230,500 | $412,800 |
| 2018 | $8,107 | $640,400 | $212,800 | $427,600 |
| 2017 | $7,789 | $607,100 | $192,800 | $414,300 |
| 2016 | $7,708 | $592,900 | $180,800 | $412,100 |
| 2015 | $7,480 | $566,700 | $162,100 | $404,600 |
Source: Public Records
Map
Nearby Homes