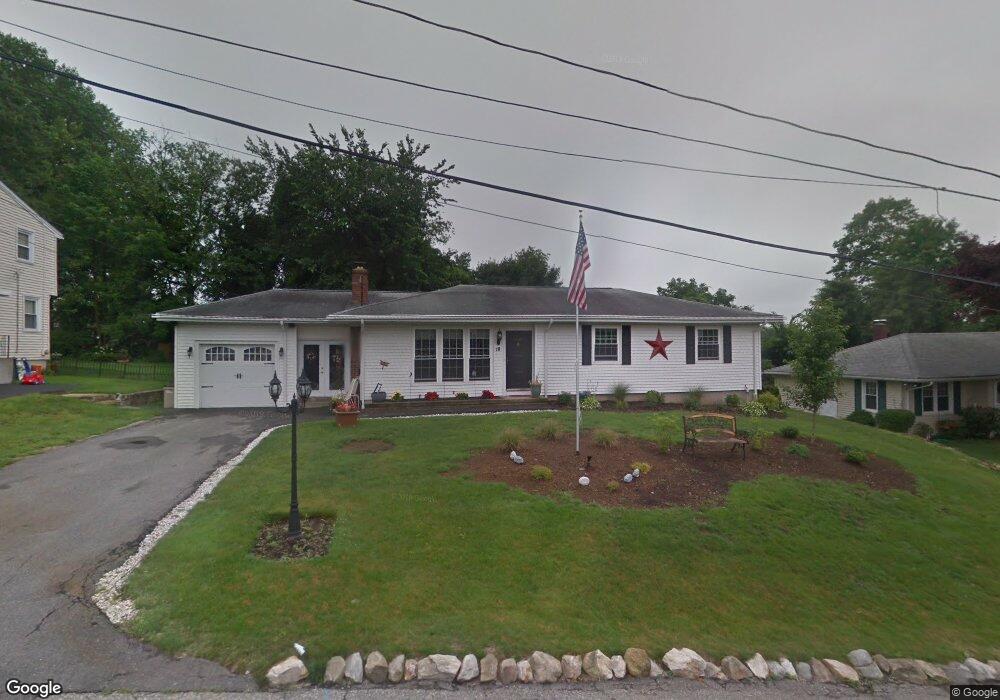
18 Rowena Dr Johnston, RI 02919
Hartford Avenue NeighborhoodEstimated Value: $404,591 - $456,000
3
Beds
1
Bath
1,380
Sq Ft
$313/Sq Ft
Est. Value
About This Home
This home is located at 18 Rowena Dr, Johnston, RI 02919 and is currently estimated at $431,648, approximately $312 per square foot. 18 Rowena Dr is a home located in Providence County with nearby schools including Johnston Senior High School and Achievement First Promesa.
Ownership History
Date
Name
Owned For
Owner Type
Purchase Details
Closed on
Aug 18, 2017
Sold by
Hendircks Adam and Hendrick Melissa M
Bought by
Hendircks Adam and Hendrick Melissa M
Current Estimated Value
Home Financials for this Owner
Home Financials are based on the most recent Mortgage that was taken out on this home.
Original Mortgage
$218,000
Outstanding Balance
$179,797
Interest Rate
3.89%
Estimated Equity
$251,851
Purchase Details
Closed on
Nov 1, 2005
Sold by
Polsell Kenneth V and Polsell Judy
Bought by
Rotella Melissa M and Hendricks Adam
Home Financials for this Owner
Home Financials are based on the most recent Mortgage that was taken out on this home.
Original Mortgage
$204,000
Interest Rate
5.79%
Mortgage Type
Purchase Money Mortgage
Create a Home Valuation Report for This Property
The Home Valuation Report is an in-depth analysis detailing your home's value as well as a comparison with similar homes in the area
Home Values in the Area
Average Home Value in this Area
Purchase History
| Date | Buyer | Sale Price | Title Company |
|---|---|---|---|
| Hendircks Adam | -- | -- | |
| Rotella Melissa M | $255,000 | -- | |
| Hendircks Adam | -- | -- | |
| Rotella Melissa M | $255,000 | -- |
Source: Public Records
Mortgage History
| Date | Status | Borrower | Loan Amount |
|---|---|---|---|
| Open | Rotella Melissa M | $218,000 | |
| Previous Owner | Rotella Melissa M | $257,500 | |
| Previous Owner | Rotella Melissa M | $204,000 |
Source: Public Records
Tax History
| Year | Tax Paid | Tax Assessment Tax Assessment Total Assessment is a certain percentage of the fair market value that is determined by local assessors to be the total taxable value of land and additions on the property. | Land | Improvement |
|---|---|---|---|---|
| 2025 | $5,006 | $320,500 | $88,000 | $232,500 |
| 2024 | $4,904 | $320,500 | $88,000 | $232,500 |
| 2023 | $4,904 | $320,500 | $88,000 | $232,500 |
| 2022 | $3,982 | $214,200 | $67,600 | $146,600 |
| 2021 | $4,978 | $214,200 | $67,600 | $146,600 |
| 2018 | $4,635 | $168,600 | $53,100 | $115,500 |
| 2016 | $6,132 | $168,600 | $53,100 | $115,500 |
| 2015 | $4,862 | $167,700 | $55,500 | $112,200 |
| 2014 | $3,857 | $167,700 | $55,500 | $112,200 |
| 2013 | $4,821 | $167,700 | $55,500 | $112,200 |
Source: Public Records
Map
Nearby Homes
- 0 Eagle St
- 1141 Hartford Ave
- 1143 Hartford Ave Unit 4C
- 24 Wilson Ave
- 23 Columbus Ave
- 56 N Olney St
- 91 Clifton St
- 46 Auburn Ave
- 0 Atwood Ave
- 15 Anita Rd
- 2 Fairmount Ave
- 0 Jackson Ave
- 19 S Long St
- 19 Hilton Dr
- 16 Homestead Ave
- 37 George Waterman Rd
- 27 Greenville Ave
- 0 Upper Farm Way Unit 1403839
- 0 Upper Farm Way Unit 1402526
- 0 Upper Farm Way Unit 1402528
Your Personal Tour Guide
Ask me questions while you tour the home.