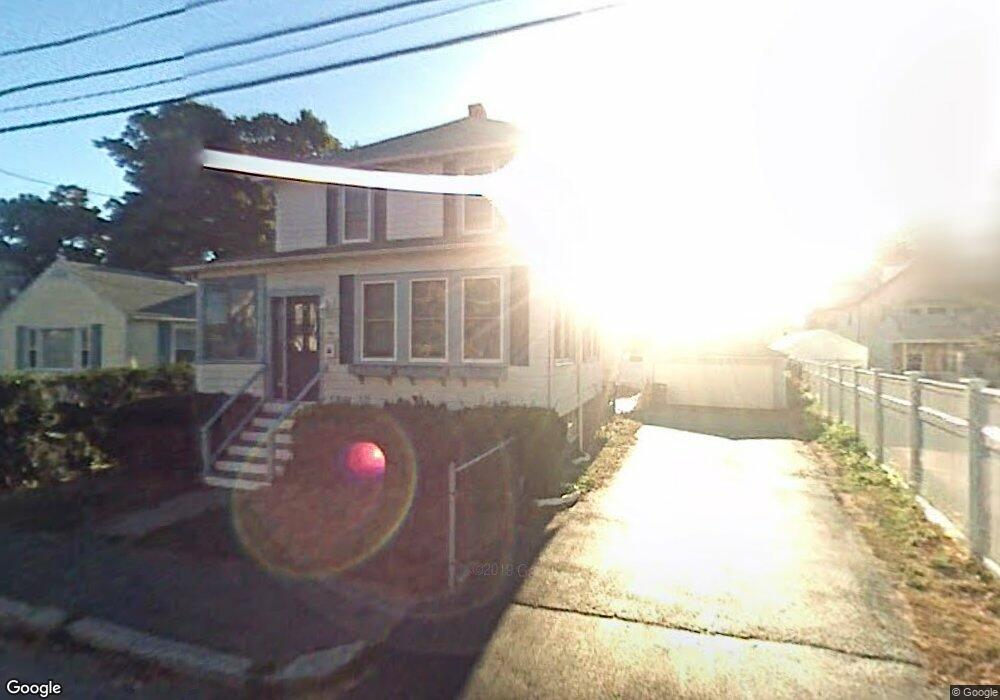
18 Ryden St Quincy, MA 02169
Quincy Center NeighborhoodEstimated Value: $663,000 - $758,000
3
Beds
2
Baths
1,354
Sq Ft
$525/Sq Ft
Est. Value
About This Home
This home is located at 18 Ryden St, Quincy, MA 02169 and is currently estimated at $711,290, approximately $525 per square foot. 18 Ryden St is a home located in Norfolk County with nearby schools including Charles A. Bernazzani Elementary School, Central Middle School, and Quincy High School.
Ownership History
Date
Name
Owned For
Owner Type
Purchase Details
Closed on
Feb 4, 2004
Sold by
Mullane Patrice M
Bought by
Ho Yiu K
Current Estimated Value
Purchase Details
Closed on
Oct 15, 1999
Sold by
Mcgrail Michael
Bought by
Mullane Patrice M
Purchase Details
Closed on
Oct 3, 1997
Sold by
Finnegan Lawrence P and Finnegan Alice A
Bought by
Mcgrail Michael
Purchase Details
Closed on
Jul 11, 1991
Sold by
Lyons Darby W and Lyons Paula
Bought by
Finnegan Lawrence P and Finnegan Alice A
Create a Home Valuation Report for This Property
The Home Valuation Report is an in-depth analysis detailing your home's value as well as a comparison with similar homes in the area
Home Values in the Area
Average Home Value in this Area
Purchase History
| Date | Buyer | Sale Price | Title Company |
|---|---|---|---|
| Ho Yiu K | $359,000 | -- | |
| Mullane Patrice M | $212,500 | -- | |
| Mcgrail Michael | $138,500 | -- | |
| Finnegan Lawrence P | $127,000 | -- |
Source: Public Records
Mortgage History
| Date | Status | Borrower | Loan Amount |
|---|---|---|---|
| Open | Finnegan Lawrence P | $198,000 | |
| Closed | Finnegan Lawrence P | $198,000 |
Source: Public Records
Tax History Compared to Growth
Tax History
| Year | Tax Paid | Tax Assessment Tax Assessment Total Assessment is a certain percentage of the fair market value that is determined by local assessors to be the total taxable value of land and additions on the property. | Land | Improvement |
|---|---|---|---|---|
| 2025 | $6,151 | $533,500 | $261,400 | $272,100 |
| 2024 | $5,812 | $515,700 | $249,000 | $266,700 |
| 2023 | $5,282 | $474,600 | $226,300 | $248,300 |
| 2022 | $5,209 | $434,800 | $205,800 | $229,000 |
| 2021 | $5,176 | $426,400 | $205,800 | $220,600 |
| 2020 | $4,965 | $399,400 | $196,000 | $203,400 |
| 2019 | $4,758 | $379,100 | $184,900 | $194,200 |
| 2018 | $4,860 | $364,300 | $184,900 | $179,400 |
| 2017 | $4,799 | $338,700 | $176,100 | $162,600 |
| 2016 | $4,597 | $320,100 | $167,700 | $152,400 |
| 2015 | $4,490 | $307,500 | $167,700 | $139,800 |
| 2014 | $4,283 | $288,200 | $159,700 | $128,500 |
Source: Public Records
Map
Nearby Homes
- 73 Cranch St Unit 73
- 1 Cityview Ln Unit 204
- 1 Cityview Ln Unit 506
- 1 Cityview Ln Unit 303
- 25 Carrolls Ln
- 118 Dimmock St
- 312 Adams St
- 73 Scotch Pond Place
- 46 Suomi Rd
- 46 Suomi Rd Unit 46
- 293 Whitwell St
- 195 Thomas Burgin Pkwy Unit 205
- 14 Priscilla Ln
- 165 Granite St
- 215 Thomas Burgin Pkwy Unit 35
- 57 Buckley St
- 89 Puritan Dr
- 77 Adams St Unit 610
- 41 Filbert St
- 56 Town Hill St Unit 56
- 14 Ryden St
- 22 Ryden St
- 17 Nilsen Ave
- 10 Ryden St
- 21 Nilsen Ave
- 13 Ryden St
- 7 Nilsen Ave Unit 1
- 7 Nilsen Ave
- 9 Nilsen Ave Unit 2
- 9 Nilsen Ave
- 7 Nilsen Ave Unit 1 & 2
- 15 Ryden St
- 28 Ryden St
- 11 Ryden St
- 11 Ryden St Unit 2
- 21 Ryden St Unit 3
- 21 Ryden St Unit 2
- 21 Ryden St Unit 1
- 21 Ryden St
- 21 Ryden St Unit C