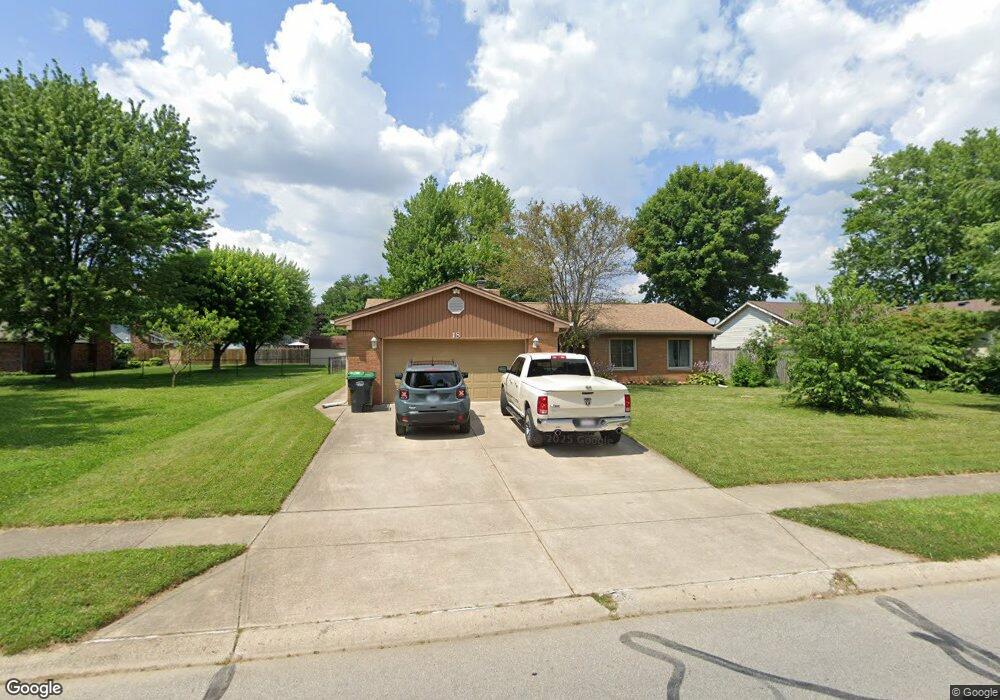
18 Rypma Row Whiteland, IN 46184
Estimated Value: $243,000 - $272,000
3
Beds
2
Baths
1,615
Sq Ft
$161/Sq Ft
Est. Value
About This Home
This home is located at 18 Rypma Row, Whiteland, IN 46184 and is currently estimated at $260,501, approximately $161 per square foot. 18 Rypma Row is a home located in Johnson County with nearby schools including Break-O-Day Elementary School, Clark-Pleasant Middle School, and Whiteland Community High School.
Ownership History
Date
Name
Owned For
Owner Type
Purchase Details
Closed on
Jun 17, 2016
Sold by
Surface Bruce W and Surface Sonna C
Bought by
Surface Jacob W and Surface Melanie B
Current Estimated Value
Home Financials for this Owner
Home Financials are based on the most recent Mortgage that was taken out on this home.
Original Mortgage
$90,000
Outstanding Balance
$71,653
Interest Rate
3.58%
Mortgage Type
New Conventional
Estimated Equity
$188,848
Create a Home Valuation Report for This Property
The Home Valuation Report is an in-depth analysis detailing your home's value as well as a comparison with similar homes in the area
Home Values in the Area
Average Home Value in this Area
Purchase History
| Date | Buyer | Sale Price | Title Company |
|---|---|---|---|
| Surface Jacob W | -- | None Available |
Source: Public Records
Mortgage History
| Date | Status | Borrower | Loan Amount |
|---|---|---|---|
| Open | Surface Jacob W | $90,000 |
Source: Public Records
Tax History Compared to Growth
Tax History
| Year | Tax Paid | Tax Assessment Tax Assessment Total Assessment is a certain percentage of the fair market value that is determined by local assessors to be the total taxable value of land and additions on the property. | Land | Improvement |
|---|---|---|---|---|
| 2025 | $1,864 | $215,100 | $51,000 | $164,100 |
| 2024 | $1,864 | $187,900 | $51,000 | $136,900 |
| 2023 | $1,980 | $190,100 | $51,000 | $139,100 |
| 2022 | $1,767 | $171,100 | $32,000 | $139,100 |
| 2021 | $1,639 | $158,300 | $32,000 | $126,300 |
| 2020 | $1,497 | $144,100 | $26,400 | $117,700 |
| 2019 | $1,372 | $132,300 | $26,400 | $105,900 |
| 2018 | $1,323 | $129,600 | $18,500 | $111,100 |
| 2017 | $1,299 | $128,000 | $18,500 | $109,500 |
| 2016 | $1,290 | $128,000 | $18,500 | $109,500 |
| 2014 | $1,353 | $131,200 | $18,500 | $112,700 |
| 2013 | $1,353 | $134,300 | $18,500 | $115,800 |
Source: Public Records
Map
Nearby Homes
- 733 Hanover Dr
- 652 Mooreland Dr
- 240 Shelton Place
- 1003 Hilltop Commons Blvd
- 0 E 700 N Unit MBR22036500
- 132 Arabian Ct
- 135 Bradford Place
- 131 Belaire Dr
- 647 Bluestem Cir
- 587 Bluestem Ln
- 114 Tracy Ridge Blvd
- 34 Crestwood Dr
- 76 Fernleaf Dr
- 152 Tracy Ridge Blvd
- Lincoln Plan at Crossroads at Southport
- Liberty Plan at Crossroads at Southport
- Rushmore Plan at Crossroads at Southport
- Jefferson Plan at Crossroads at Southport
- Washington Plan at Crossroads at Southport
- 588 Bluestem Ln