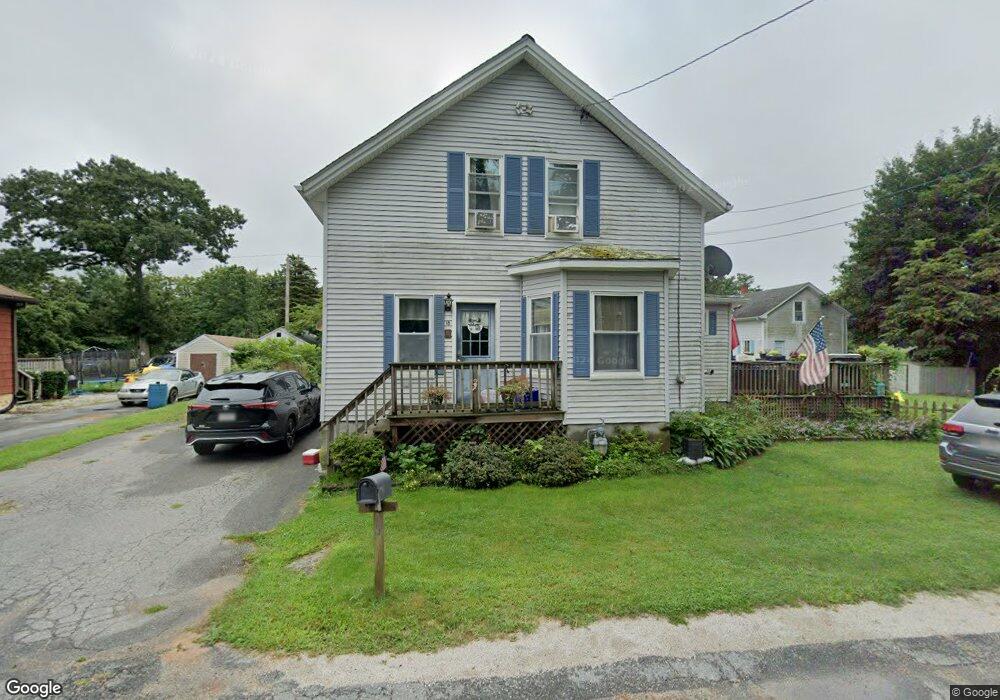
18 S Berryman St Westport, MA 02790
North Westport NeighborhoodEstimated Value: $500,000 - $639,000
4
Beds
3
Baths
2,238
Sq Ft
$257/Sq Ft
Est. Value
About This Home
This home is located at 18 S Berryman St, Westport, MA 02790 and is currently estimated at $574,153, approximately $256 per square foot. 18 S Berryman St is a home located in Bristol County with nearby schools including Alice A. Macomber Primary School, Westport Elementary School, and Westport Middle-High School.
Ownership History
Date
Name
Owned For
Owner Type
Purchase Details
Closed on
Dec 17, 2021
Sold by
Pacheco Kenneth A and Pacheco Jeannine E
Bought by
Pacheco Jeannine E
Current Estimated Value
Purchase Details
Closed on
Nov 16, 2005
Sold by
Fortin Susan
Bought by
Hawes Jordan P and Hawes Lori
Home Financials for this Owner
Home Financials are based on the most recent Mortgage that was taken out on this home.
Original Mortgage
$262,400
Interest Rate
6.07%
Mortgage Type
Purchase Money Mortgage
Purchase Details
Closed on
Jun 13, 2003
Sold by
Atteberry David C and Atteberry Filomena
Bought by
Fortin Susan
Purchase Details
Closed on
Jun 25, 1999
Sold by
Tripp Robert J
Bought by
Atteberry David C and Atteberry Filomena
Purchase Details
Closed on
Nov 15, 1996
Sold by
Fernandes Bruce and Fernandes Joanne
Bought by
Tripp Robert J and Tripp Jennifer
Create a Home Valuation Report for This Property
The Home Valuation Report is an in-depth analysis detailing your home's value as well as a comparison with similar homes in the area
Home Values in the Area
Average Home Value in this Area
Purchase History
| Date | Buyer | Sale Price | Title Company |
|---|---|---|---|
| Pacheco Jeannine E | -- | None Available | |
| Hawes Jordan P | $328,000 | -- | |
| Fortin Susan | $278,000 | -- | |
| Atteberry David C | $147,000 | -- | |
| Tripp Robert J | $142,500 | -- |
Source: Public Records
Mortgage History
| Date | Status | Borrower | Loan Amount |
|---|---|---|---|
| Previous Owner | Tripp Robert J | $332,000 | |
| Previous Owner | Tripp Robert J | $262,400 |
Source: Public Records
Tax History Compared to Growth
Tax History
| Year | Tax Paid | Tax Assessment Tax Assessment Total Assessment is a certain percentage of the fair market value that is determined by local assessors to be the total taxable value of land and additions on the property. | Land | Improvement |
|---|---|---|---|---|
| 2025 | $2,974 | $399,200 | $144,000 | $255,200 |
| 2024 | $2,976 | $385,000 | $133,400 | $251,600 |
| 2023 | $2,878 | $352,700 | $121,000 | $231,700 |
| 2022 | $2,707 | $319,200 | $115,000 | $204,200 |
| 2021 | $2,520 | $292,400 | $104,500 | $187,900 |
| 2020 | $2,312 | $274,200 | $95,000 | $179,200 |
| 2019 | $2,145 | $259,400 | $95,000 | $164,400 |
| 2018 | $3,407 | $219,100 | $82,200 | $136,900 |
| 2017 | $7,290 | $220,500 | $87,800 | $132,700 |
| 2016 | $1,709 | $216,000 | $83,300 | $132,700 |
| 2015 | $1,622 | $204,600 | $95,700 | $108,900 |
Source: Public Records
Map
Nearby Homes
- 16 S Berryman St
- 15 S Breault St
- 9 Kyle Jacob Rd
- 565 Highland Ave
- 116 Gifford Rd
- 27 Dias Ave
- 96 Forge Rd
- 20 Faulkner St
- 29 Union Ave
- 21 Evergreen St
- 55 Lakeside Ave
- 735 Reed Rd
- 3 Roller Coaster Way Unit Lot 1
- 818 Reed Rd
- 100 D Dr
- 1276 Old Fall River Rd
- 461 Reed Rd
- 19 Charles Joseph Dr
- 2 Donna Marie Dr
- 3 Diane Way
- 26 S Berryman St
- 29 Crane Ave
- 15 S Berryman St
- 12 S Berryman St
- 24 Crane Ave
- 12 S Breault St
- 8 S Breault St
- 11 S Berryman St
- 30 Crane Ave
- 27 S Berryman St
- 30 S Berryman St
- 4 S Breault St
- o Russell and Crane St
- 6 S Berryman St
- 7 S Berryman St
- 18 S Breault St
- 13 Crane Ave
- 30 Russell St
- 33 S Berryman St
- 33 S Berryman St