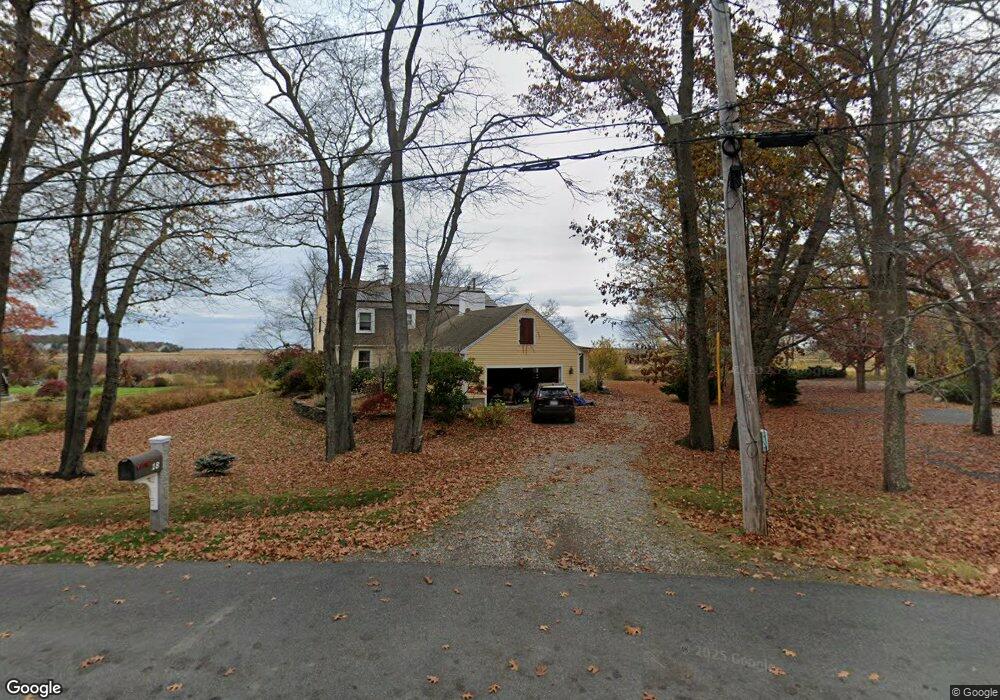
18 Seaview Ln Newbury, MA 01951
Estimated Value: $1,384,000 - $1,539,000
4
Beds
3
Baths
2,973
Sq Ft
$485/Sq Ft
Est. Value
About This Home
This home is located at 18 Seaview Ln, Newbury, MA 01951 and is currently estimated at $1,440,513, approximately $484 per square foot. 18 Seaview Ln is a home located in Essex County with nearby schools including Triton Regional High School, River Valley Charter School, and Immaculate Conception School.
Ownership History
Date
Name
Owned For
Owner Type
Purchase Details
Closed on
Sep 23, 2020
Sold by
Ballantyne Jane C and Kent Richard S
Bought by
Lim Jacqueline and Taberner Philip
Current Estimated Value
Home Financials for this Owner
Home Financials are based on the most recent Mortgage that was taken out on this home.
Original Mortgage
$680,000
Outstanding Balance
$602,083
Interest Rate
2.9%
Mortgage Type
New Conventional
Estimated Equity
$838,430
Purchase Details
Closed on
May 30, 2014
Sold by
Trezise 3Rd Fred W and Gerster Joan
Bought by
Ballantyne Jane C
Purchase Details
Closed on
Nov 4, 1992
Sold by
Mynahan Robert J and Moynahan Lynda
Bought by
Trezise Fred and Gerster Joan
Home Financials for this Owner
Home Financials are based on the most recent Mortgage that was taken out on this home.
Original Mortgage
$224,100
Interest Rate
7.99%
Mortgage Type
Purchase Money Mortgage
Create a Home Valuation Report for This Property
The Home Valuation Report is an in-depth analysis detailing your home's value as well as a comparison with similar homes in the area
Home Values in the Area
Average Home Value in this Area
Purchase History
| Date | Buyer | Sale Price | Title Company |
|---|---|---|---|
| Lim Jacqueline | $850,000 | None Available | |
| Lim Jacqueline | $850,000 | None Available | |
| Lim Jacqueline | $850,000 | None Available | |
| Ballantyne Jane C | $725,000 | -- | |
| Ballantyne Jane C | $725,000 | -- | |
| Trezise Fred | $249,000 | -- | |
| Trezise Fred | $249,000 | -- |
Source: Public Records
Mortgage History
| Date | Status | Borrower | Loan Amount |
|---|---|---|---|
| Open | Lim Jacqueline | $680,000 | |
| Closed | Lim Jacqueline | $680,000 | |
| Previous Owner | Trezise Fred | $50,000 | |
| Previous Owner | Trezise Fred | $198,000 | |
| Previous Owner | Trezise Fred | $224,100 |
Source: Public Records
Tax History Compared to Growth
Tax History
| Year | Tax Paid | Tax Assessment Tax Assessment Total Assessment is a certain percentage of the fair market value that is determined by local assessors to be the total taxable value of land and additions on the property. | Land | Improvement |
|---|---|---|---|---|
| 2025 | $8,234 | $1,105,200 | $388,300 | $716,900 |
| 2024 | $8,228 | $1,071,300 | $388,300 | $683,000 |
| 2023 | $8,231 | $949,400 | $323,600 | $625,800 |
| 2022 | $8,077 | $830,100 | $280,400 | $549,700 |
| 2021 | $7,590 | $712,000 | $215,700 | $496,300 |
| 2020 | $7,527 | $684,900 | $209,300 | $475,600 |
| 2019 | $7,404 | $684,900 | $209,300 | $475,600 |
| 2018 | $7,135 | $654,600 | $209,300 | $445,300 |
| 2017 | $6,785 | $639,500 | $209,300 | $430,200 |
| 2016 | $6,808 | $597,200 | $209,300 | $387,900 |
| 2015 | $5,949 | $516,400 | $209,300 | $307,100 |
| 2014 | $5,552 | $490,500 | $183,400 | $307,100 |
Source: Public Records
Map
Nearby Homes
- 24 Seaview Ln
- 7 Pine Island Rd
- 222 High Rd
- 182 High Rd
- 239 High Rd
- 144 High Rd
- 66 Cottage Rd
- 54 Cottage Rd
- 105 High Rd Unit Lot 2
- 100 High Rd
- 7 Marsh Ave
- 65 Plum Island Turnpike
- 28 & 30 Plum Island Turnpike
- 1 Littles Ln
- 2 Sunset Dr
- 24 Old Rowley Rd
- 11 Sunset Dr
- 2 Plum Island Blvd
- 1 Lancaster Rd
- 4 Hanover St
- 20 Seaview Ln
- 16 Seaview Ln
- 22 Seaview Ln
- 11 Seaview Ln
- 17 Seaview Ln
- 19 Seaview Ln
- 12 Seaview Ln
- 36 Old Pine Island Rd
- 9 Seaview Ln
- 32 Old Pine Island Rd
- 21 Seaview Ln
- 26 Seaview Ln
- 10 Seaview Ln
- 38 Old Pine Island Rd
- 11 Bayview Ln
- 28 Old Pine Island Rd
- 3 Seaview Ln
- 26 Old Pine Island Rd
- 8 Seaview Ln
- 9 Bayview Ln