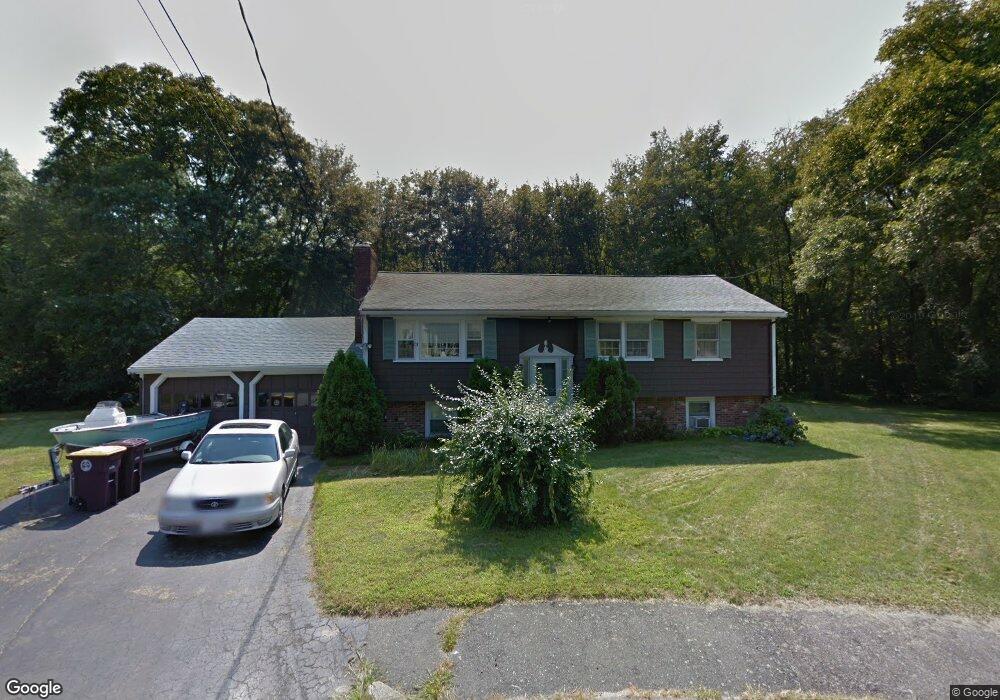
18 Shady Ln South Weymouth, MA 02190
South Weymouth NeighborhoodEstimated Value: $472,000 - $590,000
3
Beds
2
Baths
1,050
Sq Ft
$521/Sq Ft
Est. Value
About This Home
This home is located at 18 Shady Ln, South Weymouth, MA 02190 and is currently estimated at $547,447, approximately $521 per square foot. 18 Shady Ln is a home located in Norfolk County with nearby schools including Thomas V Nash, Abigail Adams Middle School, and Weymouth Middle School Chapman.
Ownership History
Date
Name
Owned For
Owner Type
Purchase Details
Closed on
Jun 25, 2021
Sold by
Jane I Ricci Ft 2015
Bought by
Ricci Catherine J and Barker Gerald E
Current Estimated Value
Home Financials for this Owner
Home Financials are based on the most recent Mortgage that was taken out on this home.
Original Mortgage
$100,000
Outstanding Balance
$90,734
Interest Rate
2.9%
Mortgage Type
Purchase Money Mortgage
Estimated Equity
$456,713
Purchase Details
Closed on
Jun 30, 2015
Sold by
Ricci Jane I
Bought by
Jane I Ricci Ft
Create a Home Valuation Report for This Property
The Home Valuation Report is an in-depth analysis detailing your home's value as well as a comparison with similar homes in the area
Home Values in the Area
Average Home Value in this Area
Purchase History
| Date | Buyer | Sale Price | Title Company |
|---|---|---|---|
| Ricci Catherine J | $365,000 | None Available | |
| Jane I Ricci Ft | -- | -- |
Source: Public Records
Mortgage History
| Date | Status | Borrower | Loan Amount |
|---|---|---|---|
| Open | Ricci Catherine J | $100,000 |
Source: Public Records
Tax History Compared to Growth
Tax History
| Year | Tax Paid | Tax Assessment Tax Assessment Total Assessment is a certain percentage of the fair market value that is determined by local assessors to be the total taxable value of land and additions on the property. | Land | Improvement |
|---|---|---|---|---|
| 2025 | $4,698 | $465,100 | $215,300 | $249,800 |
| 2024 | $5,194 | $505,700 | $205,100 | $300,600 |
| 2023 | $5,072 | $485,400 | $207,000 | $278,400 |
| 2022 | $5,046 | $440,300 | $191,700 | $248,600 |
| 2021 | $4,561 | $388,500 | $191,700 | $196,800 |
| 2020 | $4,331 | $363,300 | $191,700 | $171,600 |
| 2019 | $4,155 | $342,800 | $184,300 | $158,500 |
| 2018 | $4,063 | $325,000 | $175,500 | $149,500 |
| 2017 | $4,030 | $314,600 | $167,200 | $147,400 |
| 2016 | $3,933 | $307,300 | $160,800 | $146,500 |
| 2015 | -- | $298,500 | $160,800 | $137,700 |
| 2014 | $3,632 | $273,100 | $143,400 | $129,700 |
Source: Public Records
Map
Nearby Homes
- 24 Fisher Rd
- 68 Massapoag St Unit 7
- 211 Randolph St
- 193 Randolph St
- 16 Jay Rd
- 308 Forest St
- 120 Randolph St
- 92 Mercury St
- 134 Tyson Commons Ln
- 20 Wilbur St
- 30 Bradford Commons Ln
- 27 Park Ave
- 18 Fountain Ln Unit 2
- 262 West St
- 255 West St
- 2 Mitchell Ln Unit B
- 60 Greentree Ln Unit 38
- 11 Woodcrest Ct Unit 5
- 10 Woodcrest Ct Unit 4
- 55 Greentree Ln Unit 19