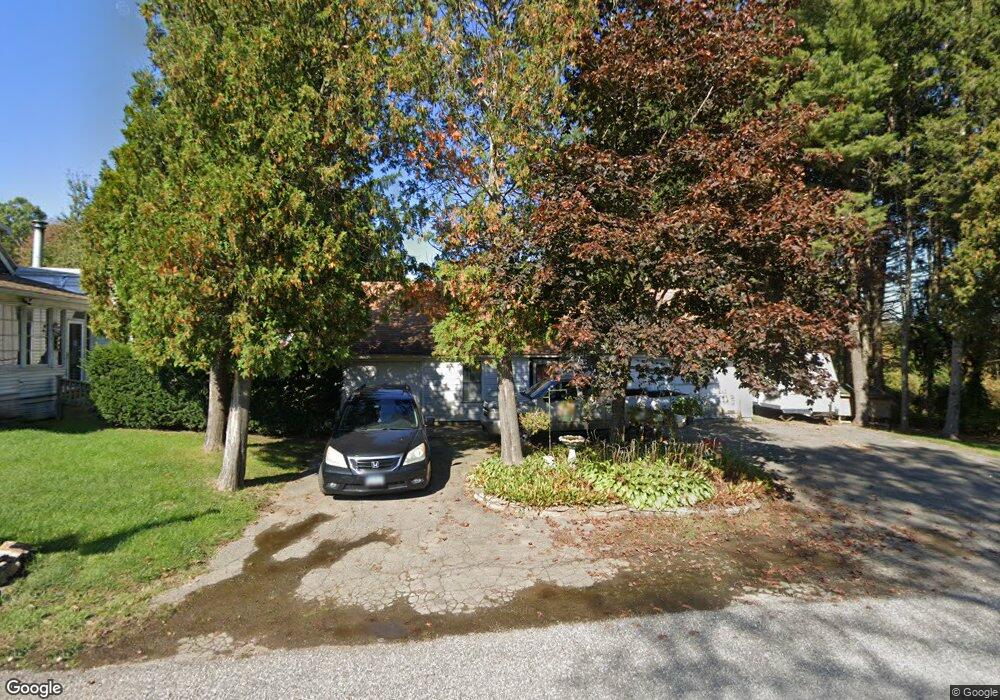
18 Sharps Mill Rd Willington, CT 06279
Estimated Value: $336,000 - $480,000
4
Beds
3
Baths
2,787
Sq Ft
$147/Sq Ft
Est. Value
About This Home
This home is located at 18 Sharps Mill Rd, Willington, CT 06279 and is currently estimated at $409,834, approximately $147 per square foot. 18 Sharps Mill Rd is a home located in Tolland County with nearby schools including Center Elementary School, Hall Memorial School, and E.O. Smith High School.
Ownership History
Date
Name
Owned For
Owner Type
Purchase Details
Closed on
Mar 11, 2022
Sold by
Bacon Peter J
Bought by
Bacon Peter J and Bacon Doris J
Current Estimated Value
Home Financials for this Owner
Home Financials are based on the most recent Mortgage that was taken out on this home.
Original Mortgage
$158,000
Outstanding Balance
$127,387
Interest Rate
3.09%
Mortgage Type
Stand Alone Refi Refinance Of Original Loan
Estimated Equity
$282,447
Purchase Details
Closed on
Jan 4, 2010
Sold by
Mayo Doris J
Bought by
Bacon Peter J
Purchase Details
Closed on
Jan 2, 2008
Sold by
Shaw Carlene D Est
Bought by
Mayo Doris J and Bacon Peter J
Home Financials for this Owner
Home Financials are based on the most recent Mortgage that was taken out on this home.
Original Mortgage
$206,442
Interest Rate
6.27%
Mortgage Type
Purchase Money Mortgage
Create a Home Valuation Report for This Property
The Home Valuation Report is an in-depth analysis detailing your home's value as well as a comparison with similar homes in the area
Home Values in the Area
Average Home Value in this Area
Purchase History
| Date | Buyer | Sale Price | Title Company |
|---|---|---|---|
| Bacon Peter J | -- | None Available | |
| Bacon Peter J | -- | None Available | |
| Bacon Peter J | -- | -- | |
| Mayo Doris J | $176,000 | -- | |
| Bacon Peter J | -- | -- | |
| Mayo Doris J | $176,000 | -- |
Source: Public Records
Mortgage History
| Date | Status | Borrower | Loan Amount |
|---|---|---|---|
| Open | Bacon Peter J | $158,000 | |
| Closed | Bacon Peter J | $158,000 | |
| Previous Owner | Mayo Doris J | $203,000 | |
| Previous Owner | Mayo Doris J | $206,442 |
Source: Public Records
Tax History Compared to Growth
Tax History
| Year | Tax Paid | Tax Assessment Tax Assessment Total Assessment is a certain percentage of the fair market value that is determined by local assessors to be the total taxable value of land and additions on the property. | Land | Improvement |
|---|---|---|---|---|
| 2025 | $6,055 | $238,180 | $51,930 | $186,250 |
| 2024 | $5,448 | $160,760 | $33,690 | $127,070 |
| 2023 | $5,170 | $160,760 | $33,690 | $127,070 |
| 2022 | $5,027 | $160,760 | $33,690 | $127,070 |
| 2021 | $4,821 | $160,760 | $33,690 | $127,070 |
| 2020 | $4,821 | $160,760 | $33,690 | $127,070 |
| 2019 | $4,837 | $160,760 | $33,690 | $127,070 |
| 2018 | $5,099 | $169,470 | $43,230 | $126,240 |
| 2017 | $5,099 | $169,470 | $43,230 | $126,240 |
| 2015 | $4,633 | $169,470 | $43,230 | $126,240 |
| 2014 | $4,633 | $169,470 | $43,230 | $126,240 |
Source: Public Records
Map
Nearby Homes
- 0 Tolland Turnpike Unit 24107059
- 39 Navratil Rd
- 0 Tolland Stage Rd Unit 24101836
- 124 River Rd
- 25 Ridgewood Rd
- 19 Thomas Dr
- 48 Angela Dr
- 0 River Rd Unit 24120753
- 5 Melissa Way
- 527 Merrow Rd
- 22 Red Oak Hill Rd
- 454 Merrow Rd
- 266 Willington Hill Rd
- 0 Jared Sparks Rd
- 152 Cedar Swamp Rd
- 317 Merrow Rd
- 312 Merrow Rd
- 284 Merrow Rd
- 167 Baxter Rd
- 999 Tolland Stage Rd
- 2 Adamec Rd
- 11 Sharps Mill Rd
- 10 Fisher Hill Rd
- 6 Adamec Rd
- 55 Glass Factory Rd
- 12 Adamec Rd
- 17 Adamec Rd
- 71 Kollar Rd
- 216 Luchon Rd Unit 218
- 19 Adamec Rd
- 32 Fisher Hill Rd
- 29 Adamec Rd
- 52 Glass Factory Rd
- 212 Luchon Rd
- 36 Fisher Hill Rd
- 35 Fisher Hill Rd
- 35 Adamec Rd
- 29 Fisher Hill Rd
- 258 River Rd
- 200 Luchon Rd