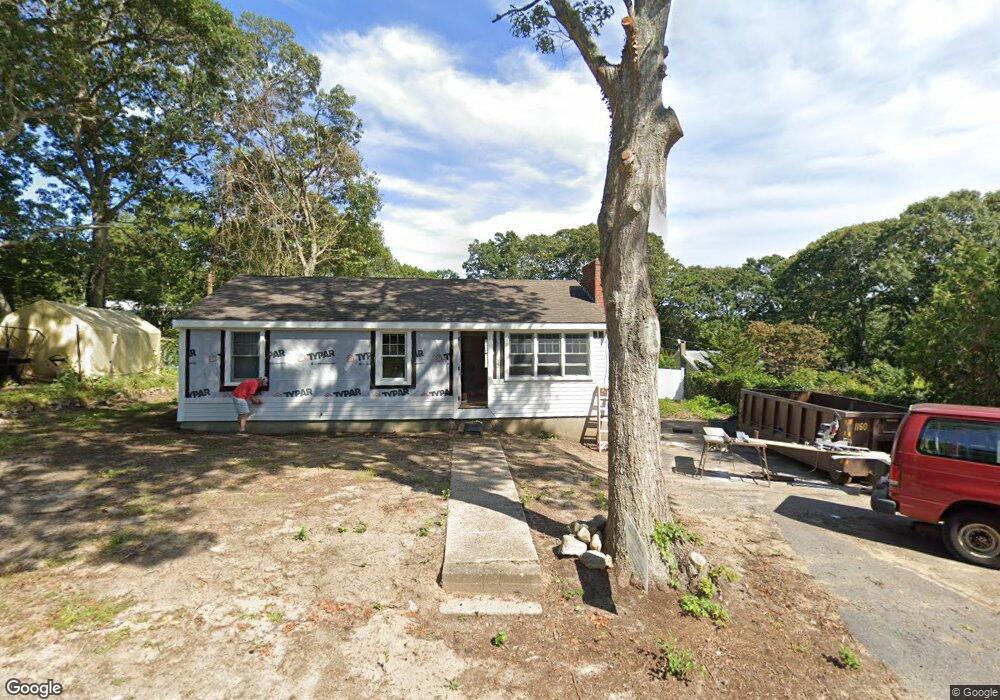
18 Signe Rd Dennis, MA 02638
Dennis Village NeighborhoodEstimated Value: $427,000 - $557,000
5
Beds
1
Bath
864
Sq Ft
$588/Sq Ft
Est. Value
About This Home
This home is located at 18 Signe Rd, Dennis, MA 02638 and is currently estimated at $508,114, approximately $588 per square foot. 18 Signe Rd is a home located in Barnstable County with nearby schools including Dennis-Yarmouth Regional High School and St. Pius X. School.
Ownership History
Date
Name
Owned For
Owner Type
Purchase Details
Closed on
Mar 12, 2025
Sold by
Glover Robert J and Glover Suzanne M
Bought by
Glover Ft and Glover
Current Estimated Value
Purchase Details
Closed on
Jun 21, 2005
Sold by
Gunwale Rt and Mariscal
Bought by
Glover Robert J
Home Financials for this Owner
Home Financials are based on the most recent Mortgage that was taken out on this home.
Original Mortgage
$150,000
Interest Rate
5.78%
Mortgage Type
Purchase Money Mortgage
Create a Home Valuation Report for This Property
The Home Valuation Report is an in-depth analysis detailing your home's value as well as a comparison with similar homes in the area
Home Values in the Area
Average Home Value in this Area
Purchase History
| Date | Buyer | Sale Price | Title Company |
|---|---|---|---|
| Glover Ft | -- | None Available | |
| Glover Robert J | $200,000 | -- | |
| Glover Robert J | $200,000 | -- |
Source: Public Records
Mortgage History
| Date | Status | Borrower | Loan Amount |
|---|---|---|---|
| Previous Owner | Glover Robert J | $150,000 |
Source: Public Records
Tax History
| Year | Tax Paid | Tax Assessment Tax Assessment Total Assessment is a certain percentage of the fair market value that is determined by local assessors to be the total taxable value of land and additions on the property. | Land | Improvement |
|---|---|---|---|---|
| 2025 | $1,992 | $460,100 | $184,500 | $275,600 |
| 2024 | $1,851 | $421,700 | $177,500 | $244,200 |
| 2023 | $1,674 | $358,500 | $136,500 | $222,000 |
| 2022 | $1,607 | $287,000 | $123,000 | $164,000 |
| 2021 | $1,536 | $254,700 | $120,600 | $134,100 |
| 2020 | $1,544 | $253,100 | $131,500 | $121,600 |
| 2019 | $1,662 | $269,300 | $161,200 | $108,100 |
| 2018 | $1,411 | $222,600 | $122,800 | $99,800 |
| 2017 | $1,411 | $229,400 | $122,800 | $106,600 |
| 2016 | $1,382 | $211,700 | $122,800 | $88,900 |
| 2015 | $1,355 | $211,700 | $122,800 | $88,900 |
| 2014 | $1,214 | $191,200 | $102,300 | $88,900 |
Source: Public Records
Map
Nearby Homes
- 59 Main St Unit 19-2
- 59 Route 6a Unit 29-4
- 26 S West Dr
- 59 Massachusetts 6a Unit 19-2
- 568 Route 6a
- 268 Main St
- 20 Bray Farm Rd S
- 15 Musket Ln
- 6 Thomas Ct
- 64 Kates Path
- 54 Kates Path Unit 54
- 15 Signal Hill Dr
- 100 Kates Path Unit 100
- 52 Uncle Bobs Way
- 15 John Hall Cartway Unit 15
- 35 Crown Grant Dr
- 228 Kates Path
- 93 Stratford Ln
- 32 Captain Walsh Dr
- 930 Old Bass River Rd
Your Personal Tour Guide
Ask me questions while you tour the home.