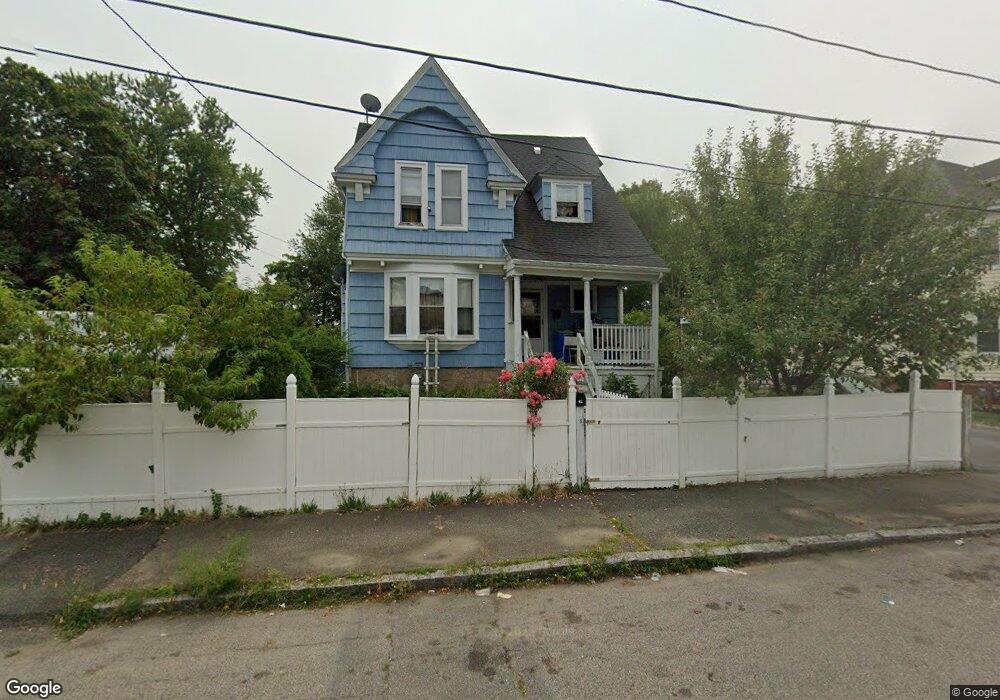
18 Silver Rd Brockton, MA 02301
Estimated Value: $492,449 - $555,000
3
Beds
1
Bath
1,874
Sq Ft
$276/Sq Ft
Est. Value
About This Home
This home is located at 18 Silver Rd, Brockton, MA 02301 and is currently estimated at $517,862, approximately $276 per square foot. 18 Silver Rd is a home located in Plymouth County with nearby schools including Manthala George Jr. School, Louis F Angelo Elementary School, and Raymond K-8 Elementary School.
Ownership History
Date
Name
Owned For
Owner Type
Purchase Details
Closed on
Mar 20, 1992
Sold by
Citicorp Mtg Inc
Bought by
Guerrier Williiot and Laurent Marie R
Current Estimated Value
Home Financials for this Owner
Home Financials are based on the most recent Mortgage that was taken out on this home.
Original Mortgage
$67,500
Interest Rate
8.62%
Mortgage Type
Purchase Money Mortgage
Purchase Details
Closed on
Jul 17, 1991
Sold by
Farrar Robert D and Campbell Lisa R
Bought by
Citicorp Mtg Inc
Purchase Details
Closed on
Jul 28, 1988
Sold by
Belanger Elise J
Bought by
Farrar Robert D
Home Financials for this Owner
Home Financials are based on the most recent Mortgage that was taken out on this home.
Original Mortgage
$121,000
Interest Rate
10.39%
Mortgage Type
Purchase Money Mortgage
Create a Home Valuation Report for This Property
The Home Valuation Report is an in-depth analysis detailing your home's value as well as a comparison with similar homes in the area
Purchase History
| Date | Buyer | Sale Price | Title Company |
|---|---|---|---|
| Guerrier Williiot | $75,000 | -- | |
| Citicorp Mtg Inc | $92,050 | -- | |
| Farrar Robert D | $134,500 | -- |
Source: Public Records
Mortgage History
| Date | Status | Borrower | Loan Amount |
|---|---|---|---|
| Closed | Farrar Robert D | $61,200 | |
| Closed | Farrar Robert D | $67,500 | |
| Previous Owner | Farrar Robert D | $121,000 |
Source: Public Records
Tax History
| Year | Tax Paid | Tax Assessment Tax Assessment Total Assessment is a certain percentage of the fair market value that is determined by local assessors to be the total taxable value of land and additions on the property. | Land | Improvement |
|---|---|---|---|---|
| 2025 | $4,769 | $393,800 | $98,700 | $295,100 |
| 2024 | $4,455 | $370,600 | $98,700 | $271,900 |
| 2023 | $4,880 | $376,000 | $76,000 | $300,000 |
| 2022 | $4,774 | $341,700 | $69,100 | $272,600 |
| 2021 | $4,330 | $298,600 | $58,100 | $240,500 |
| 2020 | $3,942 | $260,200 | $53,800 | $206,400 |
| 2019 | $3,582 | $230,500 | $52,200 | $178,300 |
| 2018 | $3,464 | $215,700 | $52,200 | $163,500 |
| 2017 | $3,234 | $200,900 | $52,200 | $148,700 |
| 2016 | $2,406 | $138,600 | $50,800 | $87,800 |
| 2015 | $2,089 | $115,100 | $50,800 | $64,300 |
| 2014 | $2,092 | $115,400 | $50,800 | $64,600 |
Source: Public Records
Map
Nearby Homes
- 4 Park Rd
- 21 Simmons Ave
- 48 Simmons Ave
- 66 Cross Ave
- 35 Colonel Bell Dr Unit 35
- 72 W Elm Terrace
- 29 Auna Dr Unit 3
- 75 Colonel Bell Dr Unit 77-11
- 11 Auna Dr Unit 10
- 11 Auna Dr Unit 6
- 226 W Elm St
- 47 N Belcher Ave
- 7 N Winnifred Rd
- 56 N Warren Ave
- 35 Brett St
- 10 Fitzpatrick Ave
- 18 Walnut St
- 60 Elm Ave
- 282 Belmont St
- 75 Thurber Ave
Your Personal Tour Guide
Ask me questions while you tour the home.