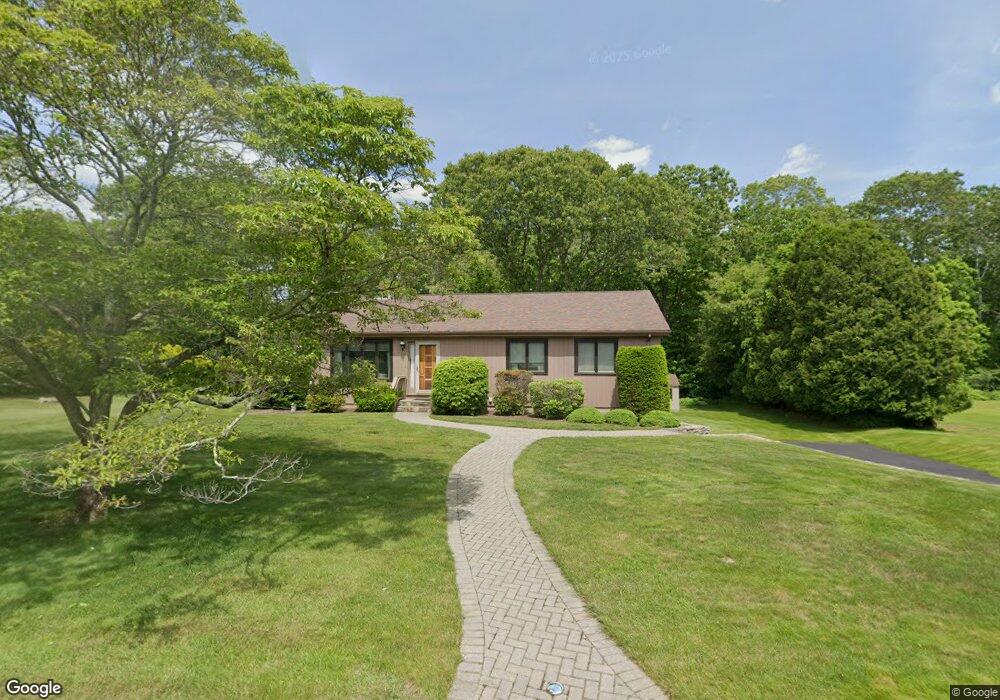
18 Soundview Dr Pawcatuck, CT 06379
Estimated Value: $428,986 - $552,000
3
Beds
2
Baths
1,232
Sq Ft
$384/Sq Ft
Est. Value
About This Home
This home is located at 18 Soundview Dr, Pawcatuck, CT 06379 and is currently estimated at $472,497, approximately $383 per square foot. 18 Soundview Dr is a home located in New London County with nearby schools including Stonington Middle School, Stonington High School, and North Stonington Christian Academy.
Ownership History
Date
Name
Owned For
Owner Type
Purchase Details
Closed on
Mar 26, 2021
Sold by
Nortz Michael and Nortz Rebecca
Bought by
Nortz T T and Nortz N
Current Estimated Value
Purchase Details
Closed on
Apr 5, 2018
Sold by
Christina James J and Christina Johanna M
Bought by
James & J Christina Irt
Purchase Details
Closed on
Apr 2, 1986
Bought by
Christina James J and Christina Johanna
Create a Home Valuation Report for This Property
The Home Valuation Report is an in-depth analysis detailing your home's value as well as a comparison with similar homes in the area
Home Values in the Area
Average Home Value in this Area
Purchase History
| Date | Buyer | Sale Price | Title Company |
|---|---|---|---|
| Nortz T T | -- | None Available | |
| Nortz T T | -- | None Available | |
| James & J Christina Irt | -- | -- | |
| James & J Christina Irt | -- | -- | |
| Christina James J | -- | -- | |
| James & J Christina Irt | -- | -- |
Source: Public Records
Mortgage History
| Date | Status | Borrower | Loan Amount |
|---|---|---|---|
| Previous Owner | Christina James J | $30,000 |
Source: Public Records
Tax History Compared to Growth
Tax History
| Year | Tax Paid | Tax Assessment Tax Assessment Total Assessment is a certain percentage of the fair market value that is determined by local assessors to be the total taxable value of land and additions on the property. | Land | Improvement |
|---|---|---|---|---|
| 2025 | $4,338 | $218,200 | $70,800 | $147,400 |
| 2024 | $4,157 | $218,200 | $70,800 | $147,400 |
| 2023 | $4,157 | $218,200 | $70,800 | $147,400 |
| 2022 | $4,080 | $159,300 | $62,200 | $97,100 |
| 2021 | $4,086 | $159,300 | $62,200 | $97,100 |
| 2020 | $4,008 | $159,300 | $62,200 | $97,100 |
| 2019 | $4,000 | $159,300 | $62,200 | $97,100 |
| 2018 | $3,865 | $159,300 | $62,200 | $97,100 |
| 2017 | $3,791 | $154,000 | $62,200 | $91,800 |
| 2016 | $3,688 | $154,000 | $62,200 | $91,800 |
| 2015 | $3,462 | $154,000 | $62,200 | $91,800 |
| 2014 | $3,386 | $154,000 | $62,200 | $91,800 |
Source: Public Records
Map
Nearby Homes
- 87 Elmridge Rd
- 414 Liberty St
- 8 Alice Ct
- 3 Fairview Dr
- 102 White Rock Rd Unit B
- 14 Springbrook Rd
- 321 N Anguilla Rd
- 15 Faulise Ave
- 16 N Anguilla Rd
- 17 Byron Dr
- 4 N Joseph St
- 5 Ichabod Ln
- 3 Joseph Ln
- Lot 2, 770 Pequot Trail
- 277 High St
- 4 Pearl St
- 12 Avery St
- 19 Nichols Ln
- 21 Nichols Ln
- 20 Providence-Nl Turnpike Unit 14A