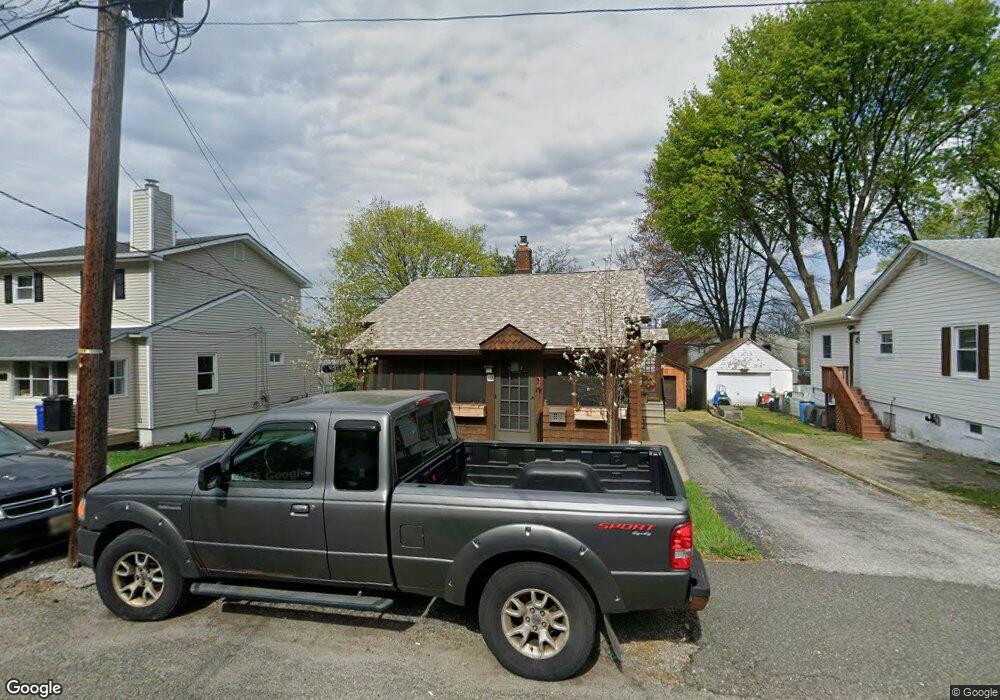
18 South St Franklin, NJ 07416
Estimated Value: $289,814 - $349,000
--
Bed
--
Bath
827
Sq Ft
$397/Sq Ft
Est. Value
About This Home
This home is located at 18 South St, Franklin, NJ 07416 and is currently estimated at $328,454, approximately $397 per square foot. 18 South St is a home located in Sussex County with nearby schools including Franklin Elementary School, Wallkill Valley Regional High School, and Immaculate Conception Regional School.
Ownership History
Date
Name
Owned For
Owner Type
Purchase Details
Closed on
Mar 23, 2018
Sold by
Doty Chantal A and Doty Robert C
Bought by
Doty Chantal A
Current Estimated Value
Purchase Details
Closed on
Jul 21, 2000
Sold by
Kupich Stephen
Bought by
Doty Robert C and Doty Chantal A
Home Financials for this Owner
Home Financials are based on the most recent Mortgage that was taken out on this home.
Original Mortgage
$122,000
Interest Rate
8.1%
Purchase Details
Closed on
Nov 20, 1995
Sold by
Wronka Mary A
Bought by
Kupich Stephen
Create a Home Valuation Report for This Property
The Home Valuation Report is an in-depth analysis detailing your home's value as well as a comparison with similar homes in the area
Home Values in the Area
Average Home Value in this Area
Purchase History
| Date | Buyer | Sale Price | Title Company |
|---|---|---|---|
| Doty Chantal A | -- | None Available | |
| Doty Robert C | $137,000 | -- | |
| Kupich Stephen | -- | -- |
Source: Public Records
Mortgage History
| Date | Status | Borrower | Loan Amount |
|---|---|---|---|
| Previous Owner | Doty Robert C | $122,000 |
Source: Public Records
Tax History Compared to Growth
Tax History
| Year | Tax Paid | Tax Assessment Tax Assessment Total Assessment is a certain percentage of the fair market value that is determined by local assessors to be the total taxable value of land and additions on the property. | Land | Improvement |
|---|---|---|---|---|
| 2025 | $5,634 | $229,700 | $100,400 | $129,300 |
| 2024 | $5,591 | $212,300 | $79,000 | $133,300 |
| 2023 | $5,591 | $202,800 | $73,300 | $129,500 |
| 2022 | $6,301 | $149,100 | $56,900 | $92,200 |
| 2021 | $6,119 | $149,100 | $56,900 | $92,200 |
| 2020 | $5,927 | $149,100 | $56,900 | $92,200 |
| 2019 | $5,658 | $149,100 | $56,900 | $92,200 |
| 2018 | $5,563 | $149,100 | $56,900 | $92,200 |
| 2017 | $5,427 | $149,100 | $56,900 | $92,200 |
| 2016 | $5,059 | $149,100 | $56,900 | $92,200 |
| 2015 | $5,076 | $149,100 | $56,900 | $92,200 |
| 2014 | $4,940 | $149,100 | $56,900 | $92,200 |
Source: Public Records
Map
Nearby Homes
- 6 South St
- 20 High Point CI
- 23 Liberty Ln Unit W5
- 309 Rutherford Ave
- 66 Nestor St
- 76 Constitution Way Unit 76
- 76 Constitution Way Unit 534
- 45 Ben Franklin Dr Unit T1
- 52 High St
- 112 Scott Rd
- 26 Wyker Rd Unit A
- 26 Wyker Rd Unit 2207
- 65 Buckwheat Rd
- 8 Fowler St Unit 10
- 65 Scott Rd
- 580 State Rt 23
- 140 Wheatsworth Rd
- 6 Mulberry St
- 50 Quarry Rd
- 212 New Jersey 23