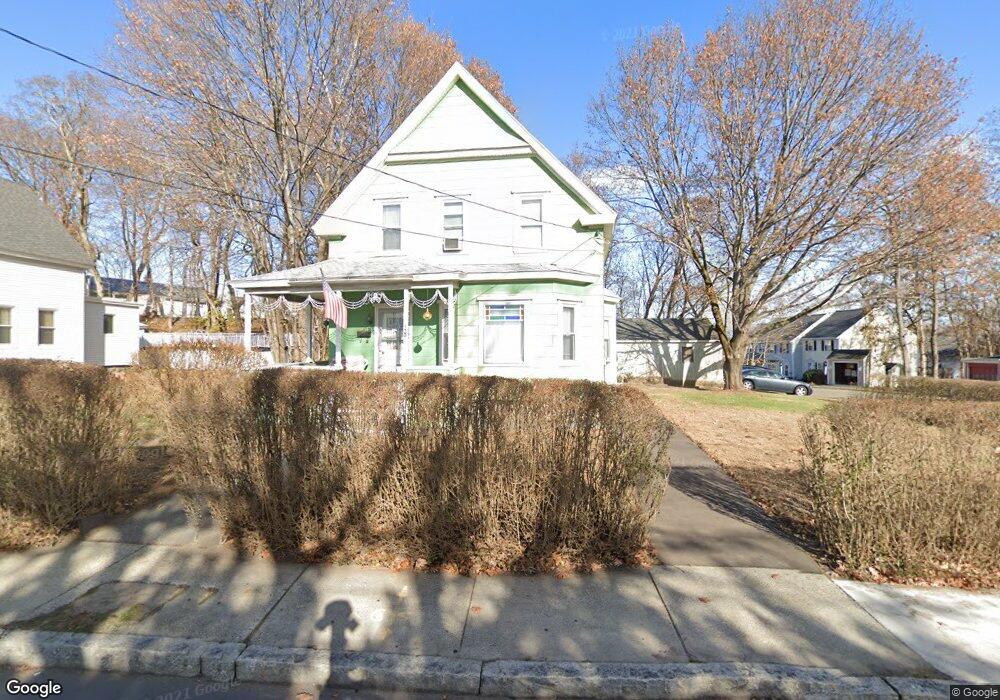
18 South St Lawrence, MA 01843
Mount Vernon NeighborhoodEstimated Value: $433,000 - $473,000
4
Beds
1
Bath
1,201
Sq Ft
$380/Sq Ft
Est. Value
About This Home
This home is located at 18 South St, Lawrence, MA 01843 and is currently estimated at $456,468, approximately $380 per square foot. 18 South St is a home located in Essex County with nearby schools including Olive Branch Elementary School, John Breen School, and School For Exceptional Studies.
Ownership History
Date
Name
Owned For
Owner Type
Purchase Details
Closed on
Apr 20, 1999
Sold by
Mcsheehey William S
Bought by
Desantis Wililam
Current Estimated Value
Home Financials for this Owner
Home Financials are based on the most recent Mortgage that was taken out on this home.
Original Mortgage
$96,300
Outstanding Balance
$24,385
Interest Rate
7.04%
Mortgage Type
Purchase Money Mortgage
Estimated Equity
$432,083
Purchase Details
Closed on
Nov 6, 1992
Sold by
Guay Donat W
Bought by
Mcsheehey William S
Home Financials for this Owner
Home Financials are based on the most recent Mortgage that was taken out on this home.
Original Mortgage
$104,650
Interest Rate
7.99%
Mortgage Type
Purchase Money Mortgage
Create a Home Valuation Report for This Property
The Home Valuation Report is an in-depth analysis detailing your home's value as well as a comparison with similar homes in the area
Home Values in the Area
Average Home Value in this Area
Purchase History
| Date | Buyer | Sale Price | Title Company |
|---|---|---|---|
| Desantis Wililam | $107,000 | -- | |
| Mcsheehey William S | $114,500 | -- |
Source: Public Records
Mortgage History
| Date | Status | Borrower | Loan Amount |
|---|---|---|---|
| Open | Mcsheehey William S | $96,300 | |
| Previous Owner | Mcsheehey William S | $104,650 |
Source: Public Records
Tax History Compared to Growth
Tax History
| Year | Tax Paid | Tax Assessment Tax Assessment Total Assessment is a certain percentage of the fair market value that is determined by local assessors to be the total taxable value of land and additions on the property. | Land | Improvement |
|---|---|---|---|---|
| 2025 | $3,191 | $362,600 | $124,800 | $237,800 |
| 2024 | $3,096 | $334,700 | $135,100 | $199,600 |
| 2023 | $3,191 | $314,100 | $125,300 | $188,800 |
| 2022 | $3,024 | $264,300 | $113,600 | $150,700 |
| 2021 | $2,980 | $242,900 | $113,600 | $129,300 |
| 2020 | $2,772 | $223,000 | $107,700 | $115,300 |
| 2019 | $2,832 | $207,000 | $89,500 | $117,500 |
| 2018 | $2,623 | $183,200 | $84,700 | $98,500 |
| 2017 | $2,577 | $168,000 | $80,000 | $88,000 |
| 2016 | $2,399 | $154,700 | $65,900 | $88,800 |
| 2015 | $2,339 | $154,700 | $65,900 | $88,800 |
Source: Public Records
Map
Nearby Homes
- 5 Lafayette Ave
- 34 Leeds Terrace
- 102 Weare St
- 24 Inman St Unit 32
- 437 N Main St Unit C
- 5 W Kenneth St
- 11 W Hawley St
- 33 Jefferson St
- 27-29 Dorchester St
- 42 Beresford St
- 356-360 S Union St
- 49 Bowdoin St Unit 51
- 15 Beaconsfield St
- 5 Marc Ln
- 19 Front St
- 91 Farnham St
- 629 Andover St
- 54 Amherst St
- 91-93 Newton St
- 132-134 S Broadway