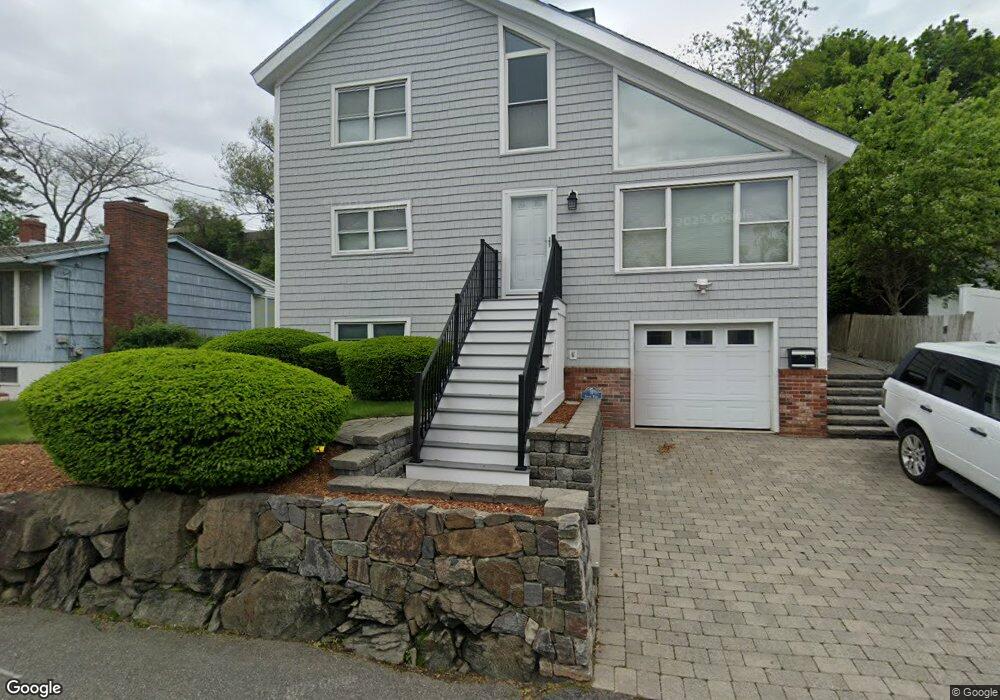
18 Spring Rd Nahant, MA 01908
Estimated Value: $914,000 - $1,016,000
3
Beds
3
Baths
2,325
Sq Ft
$407/Sq Ft
Est. Value
About This Home
This home is located at 18 Spring Rd, Nahant, MA 01908 and is currently estimated at $946,590, approximately $407 per square foot. 18 Spring Rd is a home located in Essex County with nearby schools including Johnson Elementary School, Swampscott Middle School, and Swampscott High School.
Ownership History
Date
Name
Owned For
Owner Type
Purchase Details
Closed on
Jun 24, 1999
Sold by
Woodrow Stuart and Woodrow Mary Ann
Bought by
Reed Jeffrey R
Current Estimated Value
Purchase Details
Closed on
Oct 22, 1993
Sold by
Sheppard R T
Bought by
Woodrow Stuart and Woodrow Mary Ann
Create a Home Valuation Report for This Property
The Home Valuation Report is an in-depth analysis detailing your home's value as well as a comparison with similar homes in the area
Home Values in the Area
Average Home Value in this Area
Purchase History
| Date | Buyer | Sale Price | Title Company |
|---|---|---|---|
| Reed Jeffrey R | $307,000 | -- | |
| Reed Jeffrey R | $307,000 | -- | |
| Woodrow Stuart | $208,175 | -- | |
| Woodrow Stuart | $208,175 | -- |
Source: Public Records
Mortgage History
| Date | Status | Borrower | Loan Amount |
|---|---|---|---|
| Open | Woodrow Stuart | $313,967 | |
| Closed | Woodrow Stuart | $345,000 |
Source: Public Records
Tax History
| Year | Tax Paid | Tax Assessment Tax Assessment Total Assessment is a certain percentage of the fair market value that is determined by local assessors to be the total taxable value of land and additions on the property. | Land | Improvement |
|---|---|---|---|---|
| 2025 | $7,712 | $842,800 | $413,600 | $429,200 |
| 2024 | $7,485 | $825,200 | $396,000 | $429,200 |
| 2023 | $6,722 | $739,500 | $352,000 | $387,500 |
| 2022 | $6,628 | $677,000 | $299,200 | $377,800 |
| 2021 | $6,628 | $630,600 | $281,600 | $349,000 |
| 2020 | $6,298 | $574,100 | $264,000 | $310,100 |
| 2019 | $5,710 | $523,400 | $246,400 | $277,000 |
| 2018 | $5,365 | $523,400 | $246,400 | $277,000 |
| 2017 | $5,521 | $527,300 | $246,400 | $280,900 |
| 2016 | $5,161 | $490,600 | $215,600 | $275,000 |
| 2015 | $4,860 | $445,100 | $200,200 | $244,900 |
| 2014 | $4,757 | $431,300 | $182,200 | $249,100 |
Source: Public Records
Map
Nearby Homes
- 1 Goddard Dr
- 30 Sherman Ave
- 183 Bass Point Rd
- 66 Ocean St
- 9 Little Nahant Rd
- 162 Willow Rd Unit 11
- 51 Cliff St
- 1 Carey Cir Unit 409
- 191 N Shore Rd
- 98 Lynnway
- 123 Mills Ave
- 12 Chancery Ct Unit 404
- 11 Archer Ave
- 154 Lynnway Unit 205
- 31 Mills Ave
- 103 Nahant St Unit 4
- 285 Lynn Shore Dr Unit 205
- 285 Lynn Shore Dr Unit 203
- 285 Lynn Shore Dr Unit 304
- 95 Nahant St Unit 12
Your Personal Tour Guide
Ask me questions while you tour the home.