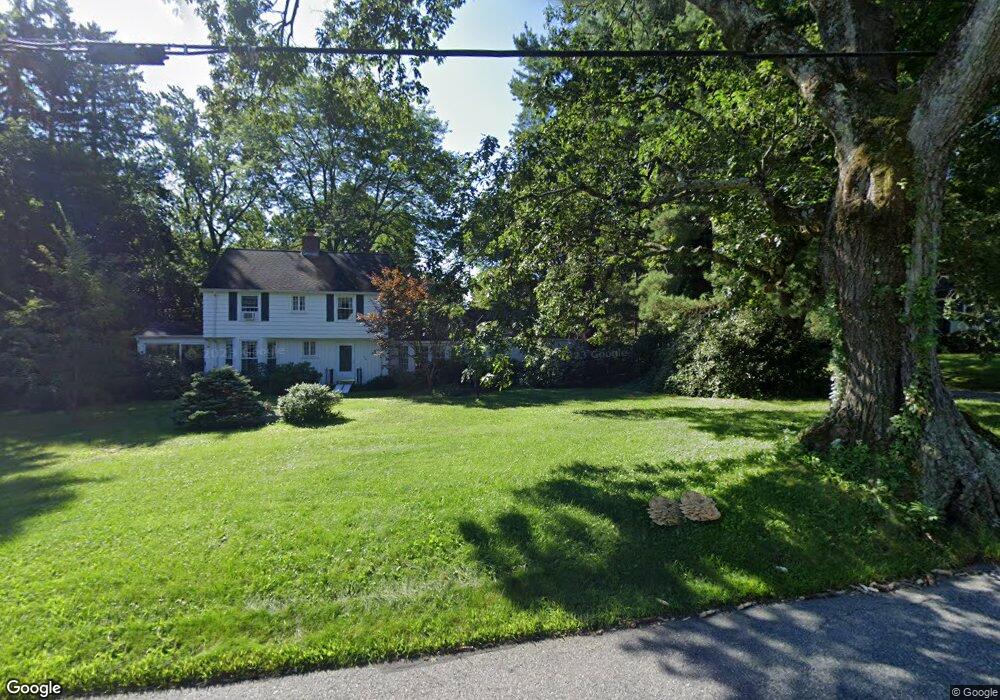
18 Spring St Shrewsbury, MA 01545
Estimated Value: $615,517 - $705,000
2
Beds
2
Baths
1,480
Sq Ft
$438/Sq Ft
Est. Value
About This Home
This home is located at 18 Spring St, Shrewsbury, MA 01545 and is currently estimated at $648,629, approximately $438 per square foot. 18 Spring St is a home located in Worcester County with nearby schools including Spring Street Elementary School, Sherwood Middle School, and Oak Middle School.
Ownership History
Date
Name
Owned For
Owner Type
Purchase Details
Closed on
Jun 29, 2007
Sold by
Nanigan Irene K Est and Nanigan
Bought by
Ottoson Anne E and Ottoson Stephen J
Current Estimated Value
Home Financials for this Owner
Home Financials are based on the most recent Mortgage that was taken out on this home.
Original Mortgage
$334,500
Outstanding Balance
$204,242
Interest Rate
6.24%
Mortgage Type
Purchase Money Mortgage
Estimated Equity
$444,387
Create a Home Valuation Report for This Property
The Home Valuation Report is an in-depth analysis detailing your home's value as well as a comparison with similar homes in the area
Home Values in the Area
Average Home Value in this Area
Purchase History
| Date | Buyer | Sale Price | Title Company |
|---|---|---|---|
| Ottoson Anne E | $445,000 | -- | |
| Ottoson Anne E | $445,000 | -- | |
| Ottoson Anne E | $445,000 | -- |
Source: Public Records
Mortgage History
| Date | Status | Borrower | Loan Amount |
|---|---|---|---|
| Open | Ottoson Anne E | $334,500 | |
| Closed | Ottoson Anne E | $334,500 |
Source: Public Records
Tax History Compared to Growth
Tax History
| Year | Tax Paid | Tax Assessment Tax Assessment Total Assessment is a certain percentage of the fair market value that is determined by local assessors to be the total taxable value of land and additions on the property. | Land | Improvement |
|---|---|---|---|---|
| 2025 | $64 | $534,000 | $303,700 | $230,300 |
| 2024 | $6,162 | $497,700 | $289,200 | $208,500 |
| 2023 | $6,071 | $462,700 | $289,200 | $173,500 |
| 2022 | $5,240 | $371,400 | $227,300 | $144,100 |
| 2021 | $4,758 | $360,700 | $227,300 | $133,400 |
| 2020 | $4,498 | $360,700 | $227,300 | $133,400 |
| 2019 | $4,290 | $341,300 | $213,900 | $127,400 |
| 2018 | $4,237 | $334,700 | $202,000 | $132,700 |
| 2017 | $4,007 | $312,300 | $184,200 | $128,100 |
| 2016 | $3,927 | $302,100 | $174,000 | $128,100 |
| 2015 | $3,755 | $284,500 | $159,200 | $125,300 |
Source: Public Records
Map
Nearby Homes