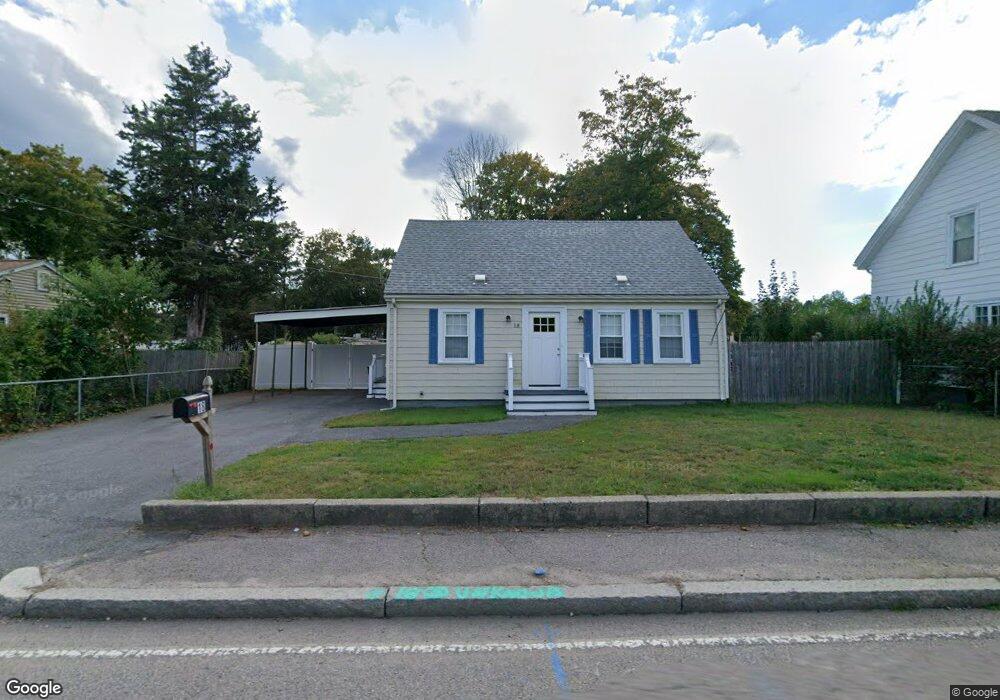
18 Starkey Ave Attleboro, MA 02703
Estimated Value: $369,000 - $392,000
3
Beds
1
Bath
1,116
Sq Ft
$341/Sq Ft
Est. Value
About This Home
This home is located at 18 Starkey Ave, Attleboro, MA 02703 and is currently estimated at $381,002, approximately $341 per square foot. 18 Starkey Ave is a home located in Bristol County with nearby schools including Thomas E. Willett School, Cyril K. Brennan Middle School, and Attleboro High School.
Ownership History
Date
Name
Owned For
Owner Type
Purchase Details
Closed on
Apr 25, 2019
Sold by
Mcandrews Matthew C and Wilmington Svgs Fund Soc
Bought by
Haskell Ronald C
Current Estimated Value
Purchase Details
Closed on
Dec 26, 2008
Sold by
Mcandrews Matthew C
Bought by
Mcandrews Christine
Purchase Details
Closed on
Dec 8, 2003
Sold by
Mcandrews Matthew C
Bought by
Mcandrews Matthew C and Mcandrews Christina A
Purchase Details
Closed on
Jan 15, 1993
Sold by
Race Iva L and Wheeling Luella Mae
Bought by
Mcandrews Matthew C
Home Financials for this Owner
Home Financials are based on the most recent Mortgage that was taken out on this home.
Original Mortgage
$56,000
Interest Rate
8.3%
Mortgage Type
Purchase Money Mortgage
Create a Home Valuation Report for This Property
The Home Valuation Report is an in-depth analysis detailing your home's value as well as a comparison with similar homes in the area
Home Values in the Area
Average Home Value in this Area
Purchase History
| Date | Buyer | Sale Price | Title Company |
|---|---|---|---|
| Haskell Ronald C | $162,000 | -- | |
| Mcandrews Christine | -- | -- | |
| Mcandrews Matthew C | -- | -- | |
| Mcandrews Matthew C | -- | -- | |
| Mcandrews Matthew C | $70,000 | -- |
Source: Public Records
Mortgage History
| Date | Status | Borrower | Loan Amount |
|---|---|---|---|
| Previous Owner | Mcandrews Matthew C | $56,000 |
Source: Public Records
Tax History Compared to Growth
Tax History
| Year | Tax Paid | Tax Assessment Tax Assessment Total Assessment is a certain percentage of the fair market value that is determined by local assessors to be the total taxable value of land and additions on the property. | Land | Improvement |
|---|---|---|---|---|
| 2025 | $3,757 | $299,400 | $121,400 | $178,000 |
| 2024 | $3,659 | $287,400 | $121,400 | $166,000 |
| 2023 | $3,439 | $251,200 | $110,400 | $140,800 |
| 2022 | $3,273 | $226,500 | $105,100 | $121,400 |
| 2021 | $3,198 | $216,100 | $101,100 | $115,000 |
| 2020 | $3,056 | $209,900 | $98,100 | $111,800 |
| 2019 | $2,887 | $203,900 | $96,300 | $107,600 |
| 2018 | $2,483 | $186,500 | $93,500 | $93,000 |
| 2017 | $2,683 | $184,400 | $93,500 | $90,900 |
| 2016 | $2,553 | $172,300 | $87,400 | $84,900 |
| 2015 | $2,427 | $165,000 | $87,400 | $77,600 |
| 2014 | $2,357 | $158,700 | $82,800 | $75,900 |
Source: Public Records
Map
Nearby Homes