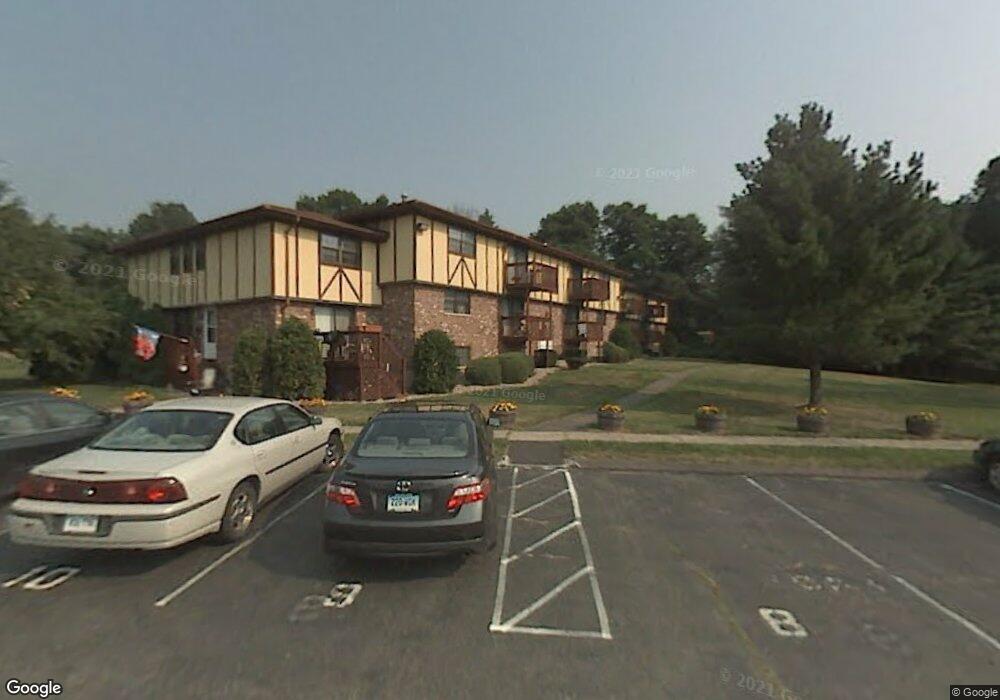
18 Surrey Dr Unit B2A Newington, CT 06111
Estimated Value: $156,000 - $179,000
1
Bed
1
Bath
720
Sq Ft
$236/Sq Ft
Est. Value
About This Home
This home is located at 18 Surrey Dr Unit B2A, Newington, CT 06111 and is currently estimated at $170,191, approximately $236 per square foot. 18 Surrey Dr Unit B2A is a home located in Hartford County with nearby schools including Anna Reynolds School, Martin Kellogg Middle School, and Newington High School.
Ownership History
Date
Name
Owned For
Owner Type
Purchase Details
Closed on
Sep 17, 2021
Sold by
Knezevic Milica
Bought by
M & M Realty Assoc Llc
Current Estimated Value
Purchase Details
Closed on
Nov 20, 2019
Sold by
Veilleux John M
Bought by
Knezevic Milica
Purchase Details
Closed on
Jan 28, 2005
Sold by
Cutler Walter and Cutler Pauline
Bought by
Veilleux John M
Home Financials for this Owner
Home Financials are based on the most recent Mortgage that was taken out on this home.
Original Mortgage
$62,500
Interest Rate
5.67%
Purchase Details
Closed on
Sep 25, 2002
Sold by
Brand Patricia I
Bought by
Zemaitis Regina
Home Financials for this Owner
Home Financials are based on the most recent Mortgage that was taken out on this home.
Original Mortgage
$62,500
Interest Rate
6.25%
Purchase Details
Closed on
May 9, 2002
Sold by
Hennelly Della
Bought by
Baranski Joanne E
Create a Home Valuation Report for This Property
The Home Valuation Report is an in-depth analysis detailing your home's value as well as a comparison with similar homes in the area
Home Values in the Area
Average Home Value in this Area
Purchase History
| Date | Buyer | Sale Price | Title Company |
|---|---|---|---|
| M & M Realty Assoc Llc | -- | None Available | |
| Knezevic Milica | $72,000 | -- | |
| Veilleux John M | $92,500 | -- | |
| Zemaitis Regina | $62,900 | -- | |
| Baranski Joanne E | $58,000 | -- |
Source: Public Records
Mortgage History
| Date | Status | Borrower | Loan Amount |
|---|---|---|---|
| Previous Owner | Baranski Joanne E | $62,500 | |
| Previous Owner | Baranski Joanne E | $62,500 |
Source: Public Records
Tax History Compared to Growth
Tax History
| Year | Tax Paid | Tax Assessment Tax Assessment Total Assessment is a certain percentage of the fair market value that is determined by local assessors to be the total taxable value of land and additions on the property. | Land | Improvement |
|---|---|---|---|---|
| 2025 | $2,015 | $50,390 | $0 | $50,390 |
| 2024 | $1,981 | $49,930 | $0 | $49,930 |
| 2023 | $1,915 | $49,930 | $0 | $49,930 |
| 2022 | $1,922 | $49,930 | $0 | $49,930 |
| 2021 | $1,938 | $49,930 | $0 | $49,930 |
| 2020 | $1,761 | $44,820 | $0 | $44,820 |
| 2019 | $1,768 | $44,820 | $0 | $44,820 |
| 2018 | $1,726 | $44,820 | $0 | $44,820 |
| 2017 | $1,640 | $44,820 | $0 | $44,820 |
| 2016 | $1,602 | $44,820 | $0 | $44,820 |
| 2014 | $1,652 | $47,520 | $0 | $47,520 |
Source: Public Records
Map
Nearby Homes
- 20 Surrey Dr Unit B16 aka B4
- 305 Hampton Ct
- 31 Dacosta Dr
- 47 Francis Dr
- 140 Camp Ave
- 16 Thornton Dr
- 148 Colonial St
- 29 Sunnyside Rd
- 54 Red Top Dr
- 107 Westgate St
- 121 Cambridge St
- 228 Reservoir Rd
- 35 Harding Ave
- 131 Williamstown Ct Unit 131
- 27 Harding Ave
- 61 Colonial St
- 479 S Main St
- 263 Williamstown Ct
- 18 Federal St
- 41 Page Ave
- 18 Surrey Dr Unit B8
- 18 Surrey Dr Unit B3
- 18 Surrey Dr Unit B1
- 18 Surrey Dr Unit B2
- 18 Surrey Dr Unit B6
- 18 Surrey Dr Unit B4
- 18 Surrey Dr Unit A2
- 18 Surrey Dr Unit A4
- 18 Surrey Dr Unit B2,aka A3
- 18 Surrey Dr Unit A3
- 20 Surrey Dr Unit B9
- 20 Surrey Dr Unit B16
- 20 Surrey Dr Unit B2
- 20 Surrey Dr Unit B13
- 20 Surrey Dr Unit B11
- 20 Surrey Dr Unit B14
- 20 Surrey Dr Unit B12
- 20 Surrey Dr Unit B10
- 105 Willard Ave
- 97 Willard Ave