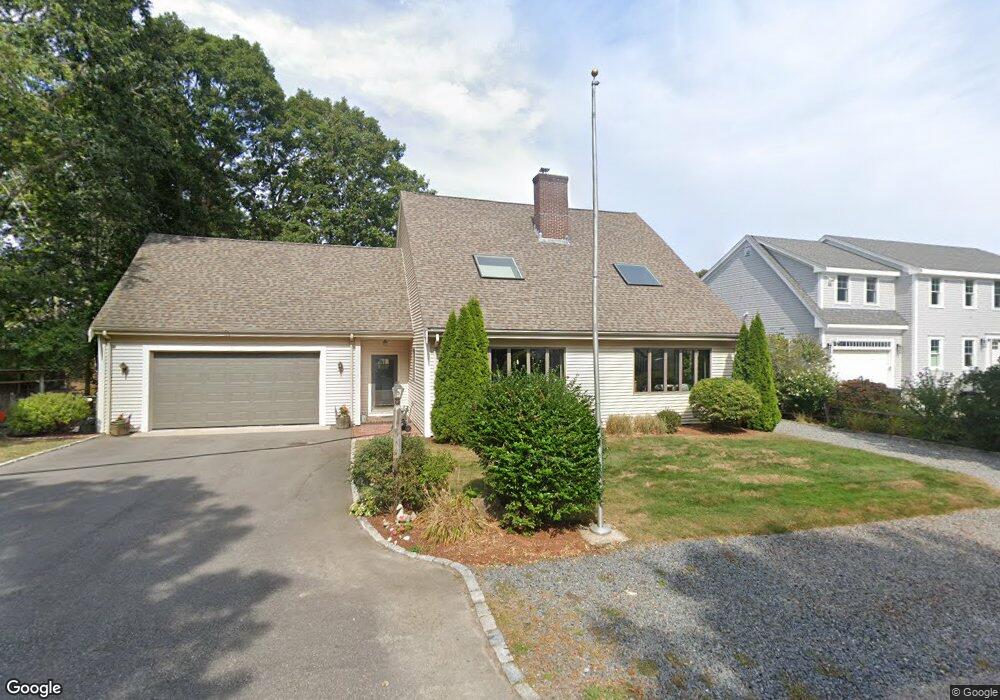
18 Tashmoo Dr East Falmouth, MA 02536
Estimated Value: $1,194,000 - $1,405,000
4
Beds
3
Baths
2,629
Sq Ft
$482/Sq Ft
Est. Value
About This Home
This home is located at 18 Tashmoo Dr, East Falmouth, MA 02536 and is currently estimated at $1,267,222, approximately $482 per square foot. 18 Tashmoo Dr is a home located in Barnstable County with nearby schools including East Falmouth Elementary School, Morse Pond School, and Lawrence School.
Ownership History
Date
Name
Owned For
Owner Type
Purchase Details
Closed on
Jul 22, 2005
Sold by
Wood Lester A and Wood Lila
Bought by
Dundulis Frank and Dundulis Patricia E
Current Estimated Value
Home Financials for this Owner
Home Financials are based on the most recent Mortgage that was taken out on this home.
Original Mortgage
$359,650
Outstanding Balance
$186,892
Interest Rate
5.59%
Mortgage Type
Purchase Money Mortgage
Estimated Equity
$1,080,330
Purchase Details
Closed on
Jul 12, 1995
Sold by
Augusta John R and Augusta Susan E
Bought by
Wood Lester A and Wood Lila
Create a Home Valuation Report for This Property
The Home Valuation Report is an in-depth analysis detailing your home's value as well as a comparison with similar homes in the area
Home Values in the Area
Average Home Value in this Area
Purchase History
| Date | Buyer | Sale Price | Title Company |
|---|---|---|---|
| Dundulis Frank | $775,000 | -- | |
| Wood Lester A | $290,000 | -- |
Source: Public Records
Mortgage History
| Date | Status | Borrower | Loan Amount |
|---|---|---|---|
| Open | Wood Lester A | $100,000 | |
| Open | Dundulis Frank | $359,650 | |
| Previous Owner | Wood Lester A | $50,000 | |
| Previous Owner | Wood Lester A | $103,000 | |
| Previous Owner | Wood Lester A | $184,000 |
Source: Public Records
Tax History Compared to Growth
Tax History
| Year | Tax Paid | Tax Assessment Tax Assessment Total Assessment is a certain percentage of the fair market value that is determined by local assessors to be the total taxable value of land and additions on the property. | Land | Improvement |
|---|---|---|---|---|
| 2025 | $6,841 | $1,165,500 | $684,900 | $480,600 |
| 2024 | $6,478 | $1,031,600 | $595,500 | $436,100 |
| 2023 | $6,288 | $908,700 | $565,800 | $342,900 |
| 2022 | $6,475 | $804,300 | $504,400 | $299,900 |
| 2021 | $6,635 | $780,600 | $504,400 | $276,200 |
| 2020 | $6,312 | $734,800 | $458,600 | $276,200 |
| 2019 | $6,138 | $717,100 | $458,600 | $258,500 |
| 2018 | $6,043 | $702,700 | $458,600 | $244,100 |
| 2017 | $5,951 | $697,700 | $458,600 | $239,100 |
| 2016 | $5,836 | $697,300 | $458,600 | $238,700 |
| 2015 | $5,711 | $697,300 | $458,600 | $238,700 |
| 2014 | $5,500 | $674,800 | $458,600 | $216,200 |
Source: Public Records
Map
Nearby Homes