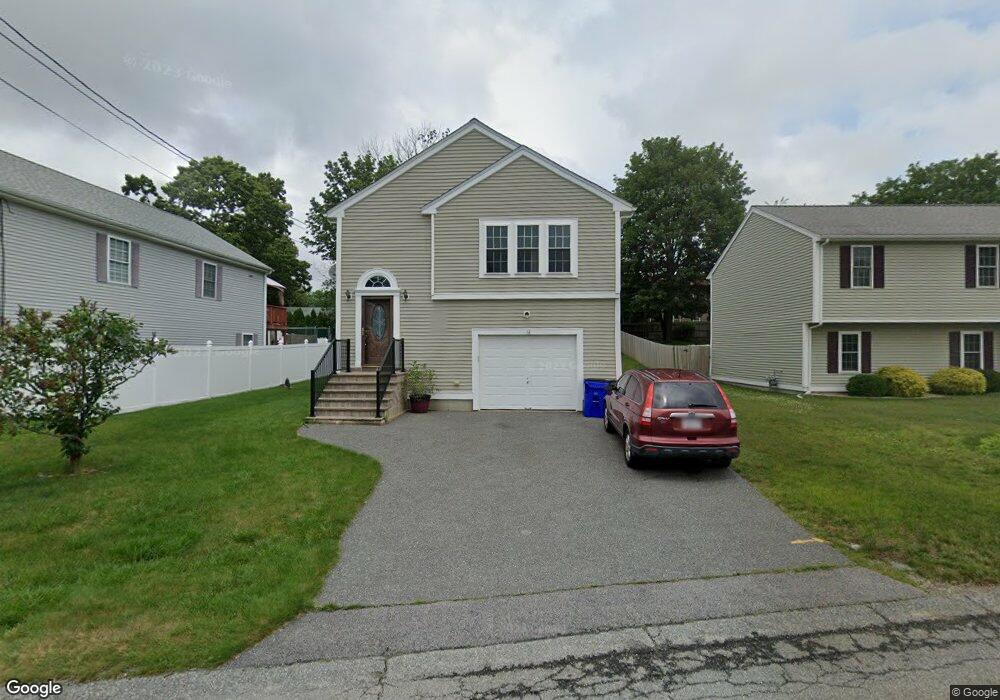
18 Terry Ln Fall River, MA 02720
Western Fall River NeighborhoodEstimated Value: $467,209 - $576,000
2
Beds
1
Bath
1,144
Sq Ft
$444/Sq Ft
Est. Value
About This Home
This home is located at 18 Terry Ln, Fall River, MA 02720 and is currently estimated at $507,552, approximately $443 per square foot. 18 Terry Ln is a home located in Bristol County with nearby schools including North End Elementary School, Morton Middle School, and B M C Durfee High School.
Ownership History
Date
Name
Owned For
Owner Type
Purchase Details
Closed on
Sep 30, 2002
Sold by
Wyche Brian K
Bought by
Martel William J
Current Estimated Value
Home Financials for this Owner
Home Financials are based on the most recent Mortgage that was taken out on this home.
Original Mortgage
$170,000
Interest Rate
6.25%
Mortgage Type
Purchase Money Mortgage
Purchase Details
Closed on
May 24, 2002
Sold by
Bannister Bruce Carl
Bought by
Wyche Brian K
Home Financials for this Owner
Home Financials are based on the most recent Mortgage that was taken out on this home.
Original Mortgage
$185,405
Interest Rate
7.01%
Mortgage Type
Purchase Money Mortgage
Purchase Details
Closed on
Sep 20, 2001
Sold by
Raven Rt and Noverca Russell A
Bought by
Bannister Bruce C
Create a Home Valuation Report for This Property
The Home Valuation Report is an in-depth analysis detailing your home's value as well as a comparison with similar homes in the area
Home Values in the Area
Average Home Value in this Area
Purchase History
| Date | Buyer | Sale Price | Title Company |
|---|---|---|---|
| Martel William J | $213,500 | -- | |
| Wyche Brian K | $192,300 | -- | |
| Bannister Bruce C | $30,000 | -- |
Source: Public Records
Mortgage History
| Date | Status | Borrower | Loan Amount |
|---|---|---|---|
| Open | Bannister Bruce C | $262,245 | |
| Closed | Bannister Bruce C | $70,000 | |
| Closed | Bannister Bruce C | $170,000 | |
| Previous Owner | Bannister Bruce C | $185,405 |
Source: Public Records
Tax History
| Year | Tax Paid | Tax Assessment Tax Assessment Total Assessment is a certain percentage of the fair market value that is determined by local assessors to be the total taxable value of land and additions on the property. | Land | Improvement |
|---|---|---|---|---|
| 2025 | $4,316 | $376,900 | $117,400 | $259,500 |
| 2024 | $3,957 | $344,400 | $115,100 | $229,300 |
| 2023 | $3,698 | $301,400 | $103,700 | $197,700 |
| 2022 | $3,373 | $267,300 | $97,800 | $169,500 |
| 2021 | $3,391 | $245,200 | $93,400 | $151,800 |
| 2020 | $3,352 | $232,000 | $89,200 | $142,800 |
| 2019 | $3,441 | $236,000 | $93,200 | $142,800 |
| 2018 | $3,272 | $223,800 | $93,900 | $129,900 |
| 2017 | $3,072 | $219,400 | $93,900 | $125,500 |
| 2016 | $2,839 | $208,300 | $96,800 | $111,500 |
| 2015 | $2,762 | $211,200 | $96,800 | $114,400 |
| 2014 | $2,657 | $211,200 | $96,800 | $114,400 |
Source: Public Records
Map
Nearby Homes
- 3636 N Main St Unit 5
- 3682 N Main St Unit 6
- 2714 Riverside Ave
- 33 Warner St
- 4234 N Main St Unit 103
- 54 Grant Ave
- 72 Ida Ln
- 232 Mount Pleasant St
- 2106 Meridian St
- 210 Harrison Ave
- Parcel 2 Highcrest Rd
- 257 Calvin St
- 1810 Highland Ave Unit 22
- 174 Columbus Dr
- 22 Apple Creek Ln
- 318 Crescent St Unit A
- 29 Valentine St
- 1553 Riverside Ave
- 274 Archer St
- 1496 Riverside Ave
Your Personal Tour Guide
Ask me questions while you tour the home.