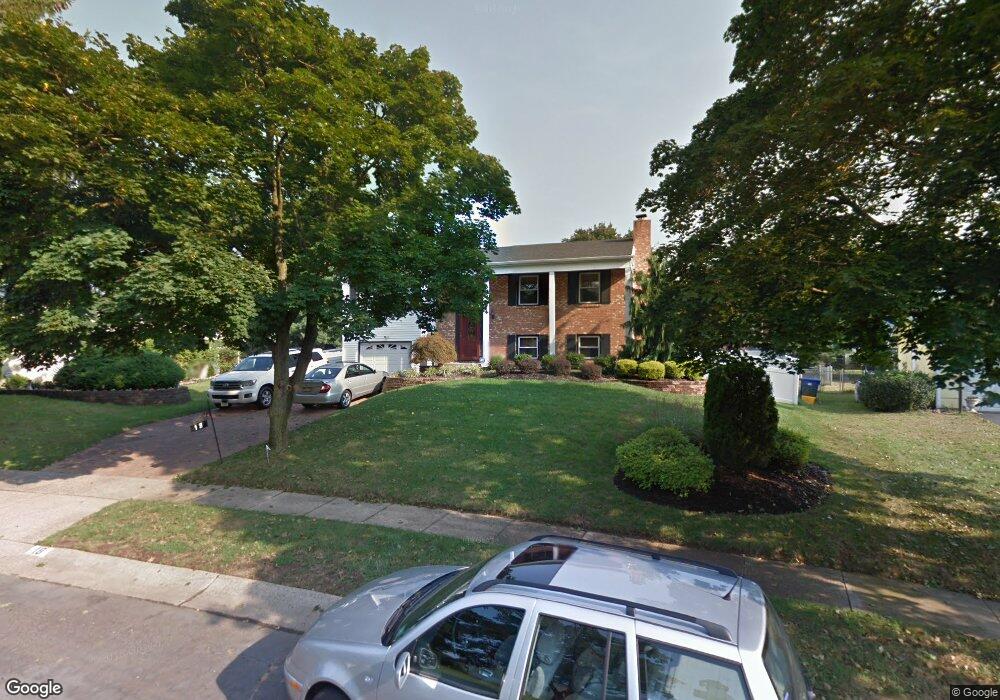
18 Tulip Ln Willingboro, NJ 08046
Estimated Value: $334,351 - $432,000
--
Bed
--
Bath
2,348
Sq Ft
$163/Sq Ft
Est. Value
About This Home
This home is located at 18 Tulip Ln, Willingboro, NJ 08046 and is currently estimated at $382,588, approximately $162 per square foot. 18 Tulip Ln is a home located in Burlington County with nearby schools including Twin Hills Elementary School, Levitt Intermediate School, and Memorial Middle School.
Ownership History
Date
Name
Owned For
Owner Type
Purchase Details
Closed on
Mar 29, 2004
Sold by
Nyahuma Jelani
Bought by
Nyahuma Malikah
Current Estimated Value
Purchase Details
Closed on
Oct 28, 2003
Sold by
Ishmael Malikah and Nyahuma Malikah
Bought by
Nyahuma Jelani and Nyahuma Malikah
Purchase Details
Closed on
Jul 8, 2003
Sold by
Ishmael Akbar
Bought by
Nyahuma Malikah
Purchase Details
Closed on
Oct 4, 1996
Sold by
Oci Mtg Corp
Bought by
Ishmael Akbar and Ismael Malikah
Purchase Details
Closed on
Dec 26, 1995
Sold by
Cummings Edward A
Bought by
Oci Mtg Corp
Create a Home Valuation Report for This Property
The Home Valuation Report is an in-depth analysis detailing your home's value as well as a comparison with similar homes in the area
Home Values in the Area
Average Home Value in this Area
Purchase History
| Date | Buyer | Sale Price | Title Company |
|---|---|---|---|
| Nyahuma Malikah | -- | -- | |
| Nyahuma Jelani | -- | -- | |
| Nyahuma Malikah | -- | -- | |
| Ishmael Akbar | $96,469 | -- | |
| Oci Mtg Corp | -- | American Title Ins Co |
Source: Public Records
Tax History Compared to Growth
Tax History
| Year | Tax Paid | Tax Assessment Tax Assessment Total Assessment is a certain percentage of the fair market value that is determined by local assessors to be the total taxable value of land and additions on the property. | Land | Improvement |
|---|---|---|---|---|
| 2025 | $8,751 | $202,700 | $43,200 | $159,500 |
| 2024 | $8,686 | $202,700 | $43,200 | $159,500 |
| 2023 | $8,686 | $202,700 | $43,200 | $159,500 |
| 2022 | $8,086 | $202,700 | $43,200 | $159,500 |
| 2021 | $8,095 | $202,700 | $43,200 | $159,500 |
| 2020 | $8,134 | $202,700 | $43,200 | $159,500 |
| 2019 | $8,057 | $202,700 | $43,200 | $159,500 |
| 2018 | $7,907 | $202,700 | $43,200 | $159,500 |
| 2017 | $7,686 | $202,700 | $43,200 | $159,500 |
| 2016 | $7,609 | $202,700 | $43,200 | $159,500 |
| 2015 | $7,348 | $202,700 | $43,200 | $159,500 |
| 2014 | $6,995 | $202,700 | $43,200 | $159,500 |
Source: Public Records
Map
Nearby Homes