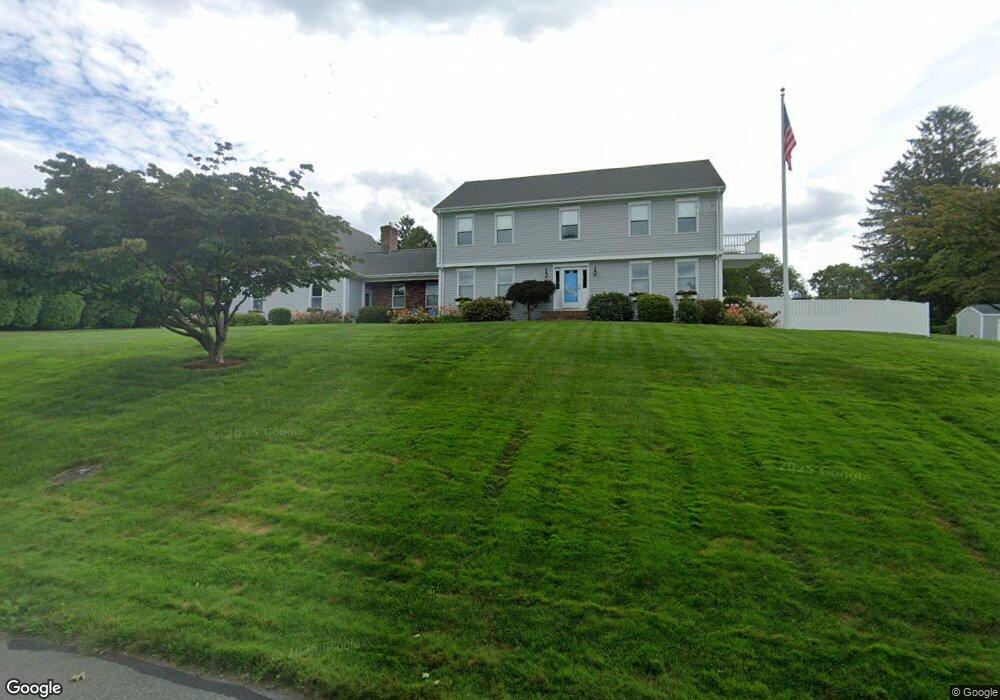
18 Upland Way Mattapoisett, MA 02739
Estimated Value: $1,175,775 - $1,443,000
3
Beds
5
Baths
4,019
Sq Ft
$330/Sq Ft
Est. Value
About This Home
This home is located at 18 Upland Way, Mattapoisett, MA 02739 and is currently estimated at $1,326,444, approximately $330 per square foot. 18 Upland Way is a home located in Plymouth County with nearby schools including Center School, Old Hammondtown Elementary, and Old Rochester Regional High School.
Ownership History
Date
Name
Owned For
Owner Type
Purchase Details
Closed on
Dec 31, 2012
Sold by
Jones James T and Jones Debra J
Bought by
Upland Cove Nt and Jones
Current Estimated Value
Purchase Details
Closed on
Aug 10, 2000
Sold by
Emily Sylvia Rt and Lawhite Betty S
Bought by
Jones James Thomas
Create a Home Valuation Report for This Property
The Home Valuation Report is an in-depth analysis detailing your home's value as well as a comparison with similar homes in the area
Home Values in the Area
Average Home Value in this Area
Purchase History
| Date | Buyer | Sale Price | Title Company |
|---|---|---|---|
| Upland Cove Nt | -- | -- | |
| Upland Cove Nt | -- | -- | |
| Jones James Thomas | $162,500 | -- | |
| Jones James Thomas | $162,500 | -- |
Source: Public Records
Mortgage History
| Date | Status | Borrower | Loan Amount |
|---|---|---|---|
| Previous Owner | Jones James Thomas | $500,000 | |
| Previous Owner | Jones James Thomas | $100,000 | |
| Previous Owner | Jones James Thomas | $150,000 |
Source: Public Records
Tax History Compared to Growth
Tax History
| Year | Tax Paid | Tax Assessment Tax Assessment Total Assessment is a certain percentage of the fair market value that is determined by local assessors to be the total taxable value of land and additions on the property. | Land | Improvement |
|---|---|---|---|---|
| 2025 | $10,661 | $990,800 | $236,700 | $754,100 |
| 2024 | $10,413 | $990,800 | $236,700 | $754,100 |
| 2023 | $10,706 | $951,600 | $231,500 | $720,100 |
| 2022 | $11,423 | $921,200 | $192,900 | $728,300 |
| 2021 | $9,956 | $768,200 | $167,700 | $600,500 |
| 2020 | $9,594 | $711,200 | $159,800 | $551,400 |
| 2019 | $9,264 | $701,300 | $159,800 | $541,500 |
| 2018 | $9,562 | $734,400 | $169,700 | $564,700 |
| 2017 | $9,193 | $703,400 | $183,800 | $519,600 |
| 2016 | $9,059 | $686,300 | $176,700 | $509,600 |
| 2015 | $8,598 | $661,400 | $166,800 | $494,600 |
| 2014 | $8,212 | $645,600 | $169,700 | $475,900 |
Source: Public Records
Map
Nearby Homes
- 9 Hitching Post Rd
- 35 North St
- 12 Cannon St
- 13 Park Place
- 7 Pearl St
- 8 Captains Ln
- 11 Captains Ln
- 52 Prince Snow Cir
- 47 Fairhaven Rd
- 15 Ned's Point Rd
- 19 High Ridge Dr
- 31 Split Rock Ln
- 83 Fairhaven Rd
- 0 Whalers Way
- 1 Starboard Way
- 41 Starboard Way
- 3 Rock St
- 6 Ocean Breeze Ln
- 0 Harbor Acres Ln - Lot B
- 3 Brandt Island Rd