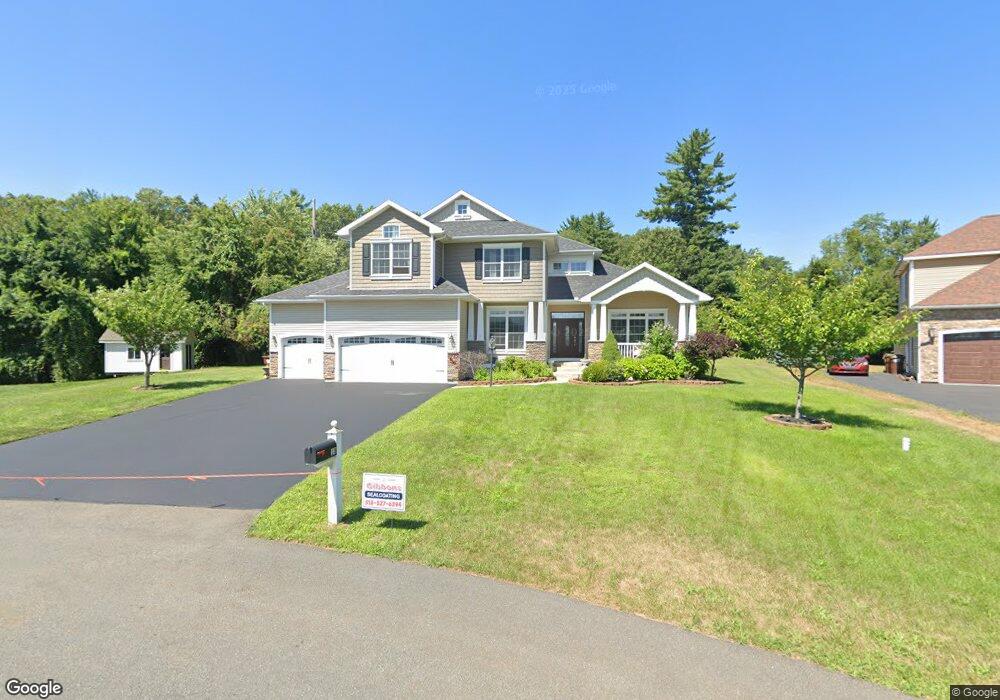
18 Vincenzo Ct Albany, NY 12203
Estimated Value: $374,000 - $861,962
3
Beds
3
Baths
2,442
Sq Ft
$279/Sq Ft
Est. Value
About This Home
This home is located at 18 Vincenzo Ct, Albany, NY 12203 and is currently estimated at $680,991, approximately $278 per square foot. 18 Vincenzo Ct is a home located in Albany County with nearby schools including Westmere Elementary School, Farnsworth Middle School, and Guilderland High School.
Ownership History
Date
Name
Owned For
Owner Type
Purchase Details
Closed on
Mar 20, 2015
Sold by
Cillis Builders Inc
Bought by
Ismail Thameen and Ismail Janofer
Current Estimated Value
Home Financials for this Owner
Home Financials are based on the most recent Mortgage that was taken out on this home.
Original Mortgage
$525,000
Interest Rate
3.37%
Mortgage Type
Adjustable Rate Mortgage/ARM
Purchase Details
Closed on
Aug 14, 2014
Sold by
R D A Associates Inc
Bought by
Cillis Builders Inc
Home Financials for this Owner
Home Financials are based on the most recent Mortgage that was taken out on this home.
Original Mortgage
$432,000
Interest Rate
4.14%
Mortgage Type
Purchase Money Mortgage
Create a Home Valuation Report for This Property
The Home Valuation Report is an in-depth analysis detailing your home's value as well as a comparison with similar homes in the area
Home Values in the Area
Average Home Value in this Area
Purchase History
| Date | Buyer | Sale Price | Title Company |
|---|---|---|---|
| Ismail Thameen | $601,000 | None Available | |
| Cillis Builders Inc | $105,000 | None Available |
Source: Public Records
Mortgage History
| Date | Status | Borrower | Loan Amount |
|---|---|---|---|
| Previous Owner | Ismail Thameen | $525,000 | |
| Previous Owner | Cillis Builders Inc | $432,000 |
Source: Public Records
Tax History Compared to Growth
Tax History
| Year | Tax Paid | Tax Assessment Tax Assessment Total Assessment is a certain percentage of the fair market value that is determined by local assessors to be the total taxable value of land and additions on the property. | Land | Improvement |
|---|---|---|---|---|
| 2024 | $6,050 | $576,000 | $93,500 | $482,500 |
| 2023 | $18,853 | $576,000 | $93,500 | $482,500 |
| 2022 | $5,830 | $576,000 | $93,500 | $482,500 |
| 2021 | $5,830 | $576,000 | $93,500 | $482,500 |
| 2020 | $5,689 | $576,000 | $93,500 | $482,500 |
| 2019 | $14,481 | $576,000 | $93,500 | $482,500 |
| 2018 | $5,580 | $576,000 | $93,500 | $482,500 |
| 2017 | $17,219 | $576,000 | $93,500 | $482,500 |
| 2016 | $11,872 | $576,000 | $93,500 | $482,500 |
| 2015 | -- | $572,700 | $93,500 | $479,200 |
| 2014 | -- | $85,500 | $85,500 | $0 |
Source: Public Records
Map
Nearby Homes