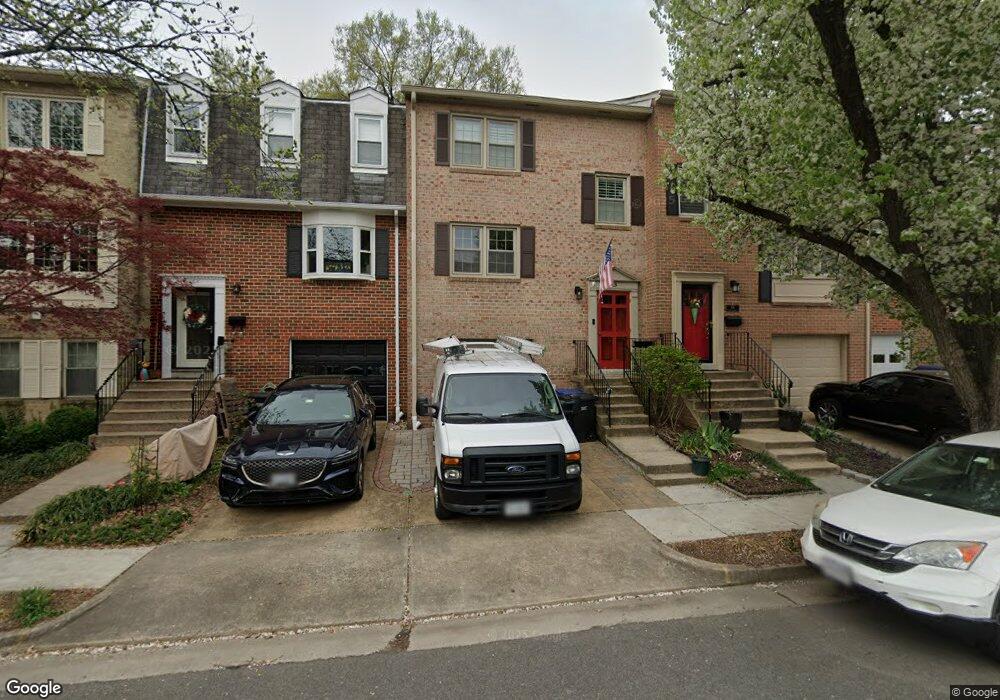
18 W Chapman St Unit A Alexandria, VA 22301
Rosemont NeighborhoodEstimated Value: $1,040,000 - $1,053,364
3
Beds
3
Baths
1,879
Sq Ft
$557/Sq Ft
Est. Value
About This Home
This home is located at 18 W Chapman St Unit A, Alexandria, VA 22301 and is currently estimated at $1,047,455, approximately $557 per square foot. 18 W Chapman St Unit A is a home located in Alexandria City with nearby schools including Naomi L. Brooks Elementary School, George Washington Middle School, and Alexandria City High School.
Ownership History
Date
Name
Owned For
Owner Type
Purchase Details
Closed on
Sep 11, 2024
Sold by
Etzl Michael M
Bought by
Etzl Family Trust and Etzl
Current Estimated Value
Purchase Details
Closed on
May 17, 2022
Sold by
Engel Megan F and Engel John J
Bought by
Etzl Michael M
Purchase Details
Closed on
Apr 16, 2013
Sold by
Kelso Barbara J
Bought by
Engel Megan F
Home Financials for this Owner
Home Financials are based on the most recent Mortgage that was taken out on this home.
Original Mortgage
$250,000
Interest Rate
3.52%
Mortgage Type
New Conventional
Purchase Details
Closed on
Apr 2, 2007
Sold by
Guokas Ralph
Bought by
Campbell Duncan and Kelso Barbara
Home Financials for this Owner
Home Financials are based on the most recent Mortgage that was taken out on this home.
Original Mortgage
$417,000
Interest Rate
6.24%
Mortgage Type
New Conventional
Create a Home Valuation Report for This Property
The Home Valuation Report is an in-depth analysis detailing your home's value as well as a comparison with similar homes in the area
Home Values in the Area
Average Home Value in this Area
Purchase History
| Date | Buyer | Sale Price | Title Company |
|---|---|---|---|
| Etzl Family Trust | -- | None Listed On Document | |
| Etzl Michael M | $890,000 | Allied Title | |
| Engel Megan F | $627,000 | -- | |
| Campbell Duncan | $575,000 | -- |
Source: Public Records
Mortgage History
| Date | Status | Borrower | Loan Amount |
|---|---|---|---|
| Previous Owner | Engel Megan F | $250,000 | |
| Previous Owner | Campbell Duncan | $417,000 |
Source: Public Records
Tax History Compared to Growth
Tax History
| Year | Tax Paid | Tax Assessment Tax Assessment Total Assessment is a certain percentage of the fair market value that is determined by local assessors to be the total taxable value of land and additions on the property. | Land | Improvement |
|---|---|---|---|---|
| 2025 | $10,829 | $898,303 | $532,397 | $365,906 |
| 2024 | $10,829 | $898,303 | $532,397 | $365,906 |
| 2023 | $9,971 | $898,303 | $532,397 | $365,906 |
| 2022 | $8,988 | $809,762 | $492,960 | $316,802 |
| 2021 | $8,778 | $790,802 | $474,000 | $316,802 |
| 2020 | $8,284 | $708,730 | $395,000 | $313,730 |
| 2019 | $7,620 | $674,371 | $365,753 | $308,618 |
| 2018 | $7,500 | $663,718 | $355,100 | $308,618 |
| 2017 | $7,128 | $630,778 | $335,000 | $295,778 |
| 2016 | $6,500 | $605,778 | $310,000 | $295,778 |
| 2015 | $5,966 | $571,997 | $287,595 | $284,402 |
| 2014 | $5,960 | $571,420 | $287,595 | $283,825 |
Source: Public Records
Map
Nearby Homes
- 104 W Myrtle St
- 400 Commonwealth Ave Unit 307
- 15 W Spring St
- 206 N View Terrace
- 110 E Spring St
- 106 E Braddock Rd
- 214 E Spring St
- 703 Braxton Place
- 605 Hilltop Terrace
- 333 Mount Vernon Ave
- 1503 Russell Rd
- 423 Mount Vernon Ave
- 507 Janneys Ln
- 16 E Monroe Ave
- 132 Roberts Ln Unit 303
- 130 Roberts Ln Unit 200
- 130 Roberts Ln Unit 201
- 304 E Nelson Ave
- 126 Roberts Ln Unit 101
- 6 E Mason Ave
- 18 W Chapman St
- 18 A W Chapman St
- 18 W Chapman Street A
- 16 W Chapman St Unit A
- 16 W Chapman St
- 16 W Chapman St Unit 16
- 16 A W Chapman St
- 16 A W Chapman St Unit A
- 20 W Chapman St
- 20 W Chapman St Unit A
- 14 W Chapman St
- 14 W Chapman St Unit A
- 17 W Oak St
- 15 W Oak St
- 15A W Chapman St
- 22a W Chapman St
- 19 W Oak St
- 12 W Chapman St
- 12 W Chapman St Unit A
- 15 Chapman Street A W