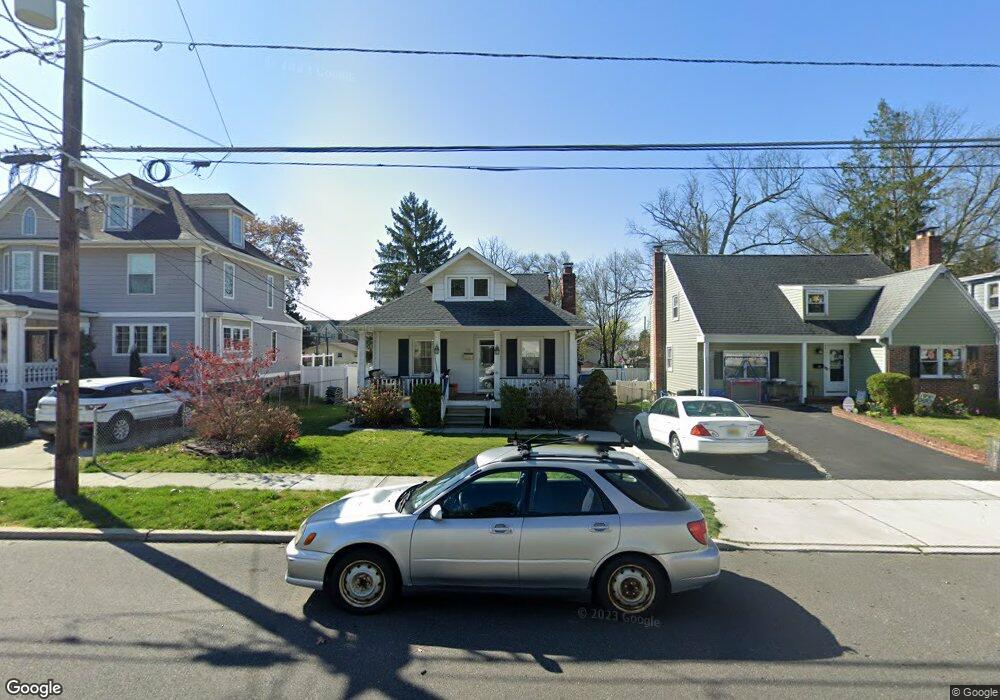
18 W Linwood Ave Maple Shade, NJ 08052
Estimated Value: $336,000 - $422,000
3
Beds
2
Baths
1,317
Sq Ft
$286/Sq Ft
Est. Value
About This Home
This home is located at 18 W Linwood Ave, Maple Shade, NJ 08052 and is currently estimated at $377,210, approximately $286 per square foot. 18 W Linwood Ave is a home located in Burlington County with nearby schools including Ralph J Steinhauer Elementary School, Maude M. Wilkins Elementary School, and Howard R Yocum School.
Ownership History
Date
Name
Owned For
Owner Type
Purchase Details
Closed on
May 28, 2010
Sold by
Hughes Ryan and Hughes Ericka
Bought by
Cohen Seth R
Current Estimated Value
Home Financials for this Owner
Home Financials are based on the most recent Mortgage that was taken out on this home.
Original Mortgage
$232,864
Outstanding Balance
$160,067
Interest Rate
5.5%
Mortgage Type
FHA
Estimated Equity
$217,143
Purchase Details
Closed on
Feb 28, 2005
Sold by
Renwick David A and Renwick Christine
Bought by
Hughes Ryan
Home Financials for this Owner
Home Financials are based on the most recent Mortgage that was taken out on this home.
Original Mortgage
$167,275
Interest Rate
5.64%
Mortgage Type
FHA
Purchase Details
Closed on
Oct 23, 1998
Sold by
Cline Marc D and Cline Florence A
Bought by
Renwick David A
Home Financials for this Owner
Home Financials are based on the most recent Mortgage that was taken out on this home.
Original Mortgage
$87,200
Interest Rate
6.64%
Create a Home Valuation Report for This Property
The Home Valuation Report is an in-depth analysis detailing your home's value as well as a comparison with similar homes in the area
Home Values in the Area
Average Home Value in this Area
Purchase History
| Date | Buyer | Sale Price | Title Company |
|---|---|---|---|
| Cohen Seth R | $236,000 | Title America Agency Corp | |
| Hughes Ryan | $169,900 | Commonwealth Land Title Insu | |
| Renwick David A | $109,000 | Surety Title Corporation |
Source: Public Records
Mortgage History
| Date | Status | Borrower | Loan Amount |
|---|---|---|---|
| Open | Cohen Seth R | $232,864 | |
| Previous Owner | Hughes Ryan | $167,275 | |
| Previous Owner | Renwick David A | $87,200 |
Source: Public Records
Tax History Compared to Growth
Tax History
| Year | Tax Paid | Tax Assessment Tax Assessment Total Assessment is a certain percentage of the fair market value that is determined by local assessors to be the total taxable value of land and additions on the property. | Land | Improvement |
|---|---|---|---|---|
| 2025 | $7,068 | $186,200 | $46,600 | $139,600 |
| 2024 | $6,863 | $186,200 | $46,600 | $139,600 |
| 2023 | $6,863 | $186,200 | $46,600 | $139,600 |
| 2022 | $6,757 | $186,200 | $46,600 | $139,600 |
| 2021 | $6,692 | $186,200 | $46,600 | $139,600 |
| 2020 | $6,711 | $186,200 | $46,600 | $139,600 |
| 2019 | $6,465 | $186,200 | $46,600 | $139,600 |
| 2018 | $6,353 | $186,200 | $46,600 | $139,600 |
| 2017 | $6,279 | $186,200 | $46,600 | $139,600 |
| 2016 | $6,186 | $186,200 | $46,600 | $139,600 |
| 2015 | $6,052 | $186,200 | $46,600 | $139,600 |
| 2014 | $5,867 | $186,200 | $46,600 | $139,600 |
Source: Public Records
Map
Nearby Homes
- 22 Theodore Ave
- 105 Mecray Ln
- 505 Greenwood Ave
- 15 N Poplar Ave
- 57 S Terrace Ave
- 480 W Front St
- 4 W Germantown Ave
- 500 E Woodlawn Ave
- 204 W Germantown Ave
- 107 S Forklanding Rd
- 524 W Main St
- 124 Stiles Ave
- 218 E Germantown Ave
- 425 Stiles Ave
- 231 S Forklanding Rd
- 431 E Park Ave
- 411 Stiles Ave Unit A7
- 411 Stiles Ave
- 32 Woodbine Ave
- 41 Orchard Ave
- 14 W Linwood Ave
- 22 W Linwood Ave
- 10 W Linwood Ave
- 26 W Linwood Ave
- 29 W Broadway
- 30 W Linwood Ave
- 33 W Broadway
- 25 W Broadway
- 15 W Linwood Ave
- 21 W Broadway
- 37 W Broadway
- 124 N Forklanding Rd
- 34 W Linwood Ave
- 122 N Forklanding Rd
- 120 N Forklanding Rd
- 126 N Forklanding Rd
- 41 W Broadway
- 17 W Broadway
- 23 W Linwood Ave
- 116 N Forklanding Rd