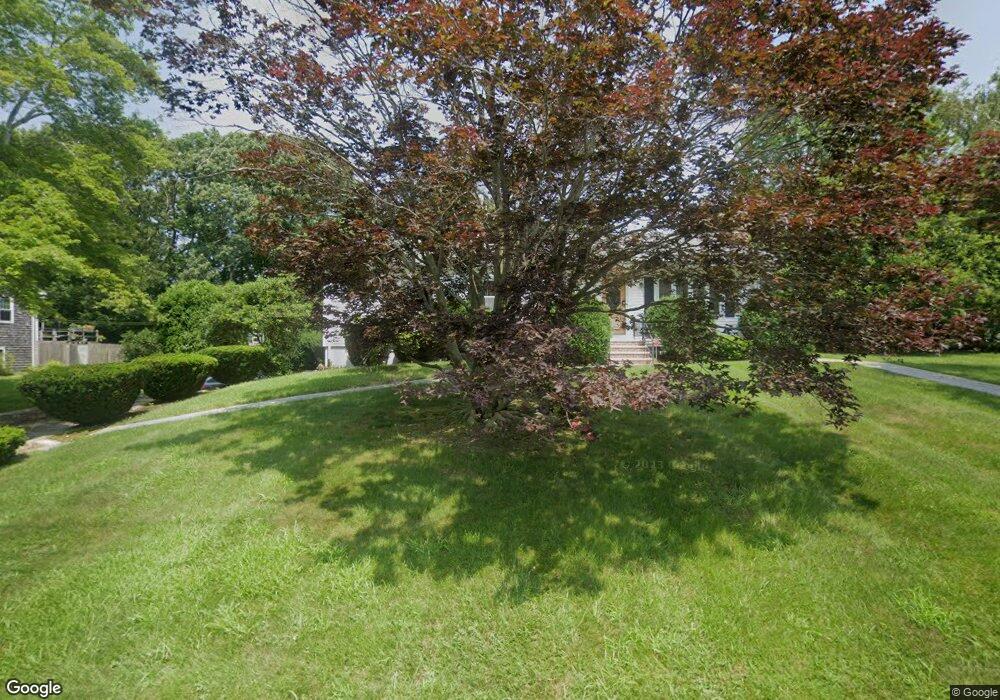
18 W Sherman St North Dartmouth, MA 02747
North Apponagansett NeighborhoodEstimated Value: $462,000 - $597,000
3
Beds
1
Bath
1,352
Sq Ft
$389/Sq Ft
Est. Value
About This Home
This home is located at 18 W Sherman St, North Dartmouth, MA 02747 and is currently estimated at $526,216, approximately $389 per square foot. 18 W Sherman St is a home located in Bristol County with nearby schools including Dartmouth High School, Friends Academy, and Our Sister's School.
Ownership History
Date
Name
Owned For
Owner Type
Purchase Details
Closed on
Mar 6, 2006
Sold by
Soares Maria F and Soares Maria I
Bought by
Maria F Soares Ft
Current Estimated Value
Purchase Details
Closed on
Sep 30, 1997
Sold by
Hendricks Leonard F
Bought by
Mcnamara George F and Mc Namara Pamela W
Home Financials for this Owner
Home Financials are based on the most recent Mortgage that was taken out on this home.
Original Mortgage
$146,250
Interest Rate
7.47%
Mortgage Type
Purchase Money Mortgage
Purchase Details
Closed on
Oct 25, 1995
Sold by
Soares Manuel
Bought by
Stpierre Thomas M and Frates Cynthia A
Create a Home Valuation Report for This Property
The Home Valuation Report is an in-depth analysis detailing your home's value as well as a comparison with similar homes in the area
Home Values in the Area
Average Home Value in this Area
Purchase History
| Date | Buyer | Sale Price | Title Company |
|---|---|---|---|
| Maria F Soares Ft | -- | -- | |
| Mcnamara George F | $195,000 | -- | |
| Stpierre Thomas M | $45,000 | -- | |
| Family Home Const Co | $45,000 | -- |
Source: Public Records
Mortgage History
| Date | Status | Borrower | Loan Amount |
|---|---|---|---|
| Previous Owner | Family Home Const Co | $20,000 | |
| Previous Owner | Family Home Const Co | $146,250 |
Source: Public Records
Tax History Compared to Growth
Tax History
| Year | Tax Paid | Tax Assessment Tax Assessment Total Assessment is a certain percentage of the fair market value that is determined by local assessors to be the total taxable value of land and additions on the property. | Land | Improvement |
|---|---|---|---|---|
| 2025 | $3,600 | $418,100 | $182,100 | $236,000 |
| 2024 | $3,507 | $403,600 | $168,500 | $235,100 |
| 2023 | $3,445 | $375,700 | $163,100 | $212,600 |
| 2022 | $3,371 | $340,500 | $163,100 | $177,400 |
| 2021 | $3,303 | $318,800 | $151,700 | $167,100 |
| 2020 | $3,149 | $303,400 | $143,800 | $159,600 |
| 2019 | $3,067 | $294,900 | $137,200 | $157,700 |
| 2018 | $2,934 | $290,200 | $150,400 | $139,800 |
| 2017 | $2,799 | $279,300 | $141,900 | $137,400 |
| 2016 | $2,689 | $264,700 | $135,700 | $129,000 |
| 2015 | $2,610 | $257,400 | $126,800 | $130,600 |
| 2014 | $2,545 | $249,300 | $121,400 | $127,900 |
Source: Public Records
Map
Nearby Homes
- 6 Jacob Dr
- 5 Samosett Dr
- 3 Mishawum Dr
- 33 Rosewood Terrace
- 29 Elizabeth Ct
- 360 Russells Mills Rd
- 212 Rockland St
- 25 Westwood Dr
- 6 Walters Way
- 21 Avis St
- 179 Rockland St
- 75 Country Way Unit 75
- 98 Mccabe St
- 76 Shipyard Ln
- 48 Wilson St
- 1004 Allen St
- 34 Country Way
- 0 Victoria St Unit 73457953
- 10 Westview Dr
- 32 Fulton St