Estimated Value: $220,311 - $332,000
--
Bed
--
Bath
1,440
Sq Ft
$198/Sq Ft
Est. Value
About This Home
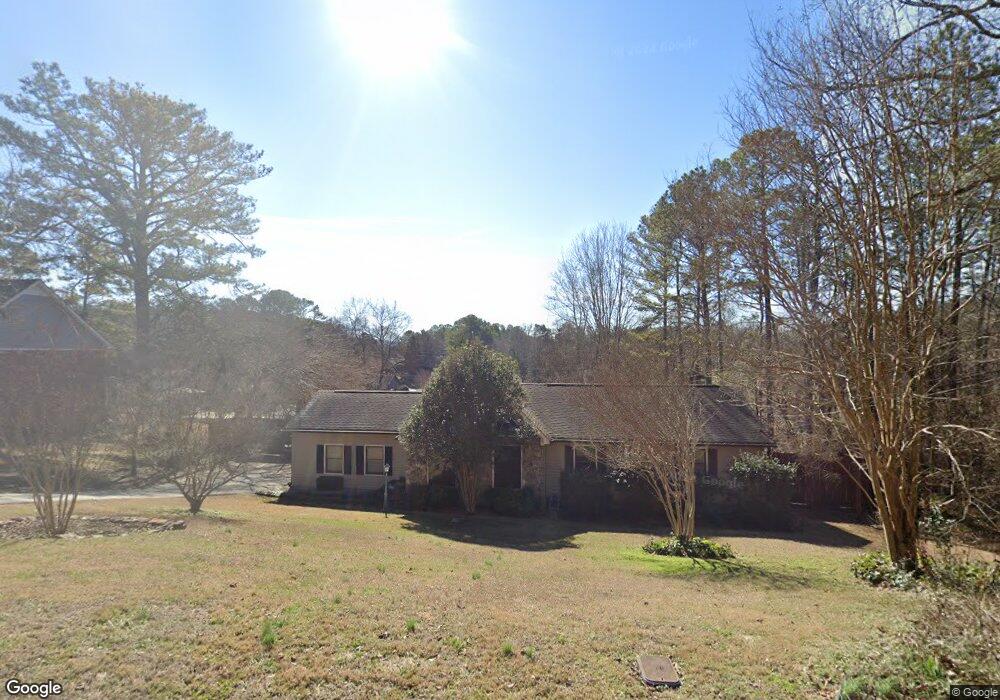
This home is located at 18 Warwick Way SE, Rome, GA 30161 and is currently estimated at $285,828, approximately $198 per square foot. 18 Warwick Way SE is a home located in Floyd County with nearby schools including Pepperell Middle School, Pepperell High School, and Montessori School of Rome.
Ownership History
Date
Name
Owned For
Owner Type
Purchase Details
Closed on
Jul 13, 2016
Sold by
Blyseth Gordon L
Bought by
Ware Richard L
Current Estimated Value
Purchase Details
Closed on
Jun 13, 2002
Sold by
Goff Rita F
Bought by
Ware Richard L and Ronda Ware
Purchase Details
Closed on
Feb 24, 1998
Sold by
Goff James H and Goff Rita F
Bought by
Goff Rita F
Purchase Details
Closed on
May 18, 1994
Sold by
Bramonte John S and Bramonte Bebhinn D
Bought by
Goff James H and Goff Rita F
Purchase Details
Closed on
Apr 6, 1992
Sold by
Highfield Terry Ann
Bought by
Bramonte John S and Bramonte Bebhinn D
Purchase Details
Closed on
May 23, 1991
Sold by
Casey J W
Bought by
Highfield Terry Ann
Purchase Details
Closed on
Aug 2, 1983
Sold by
N R S Properties Inc
Bought by
Casey J W
Purchase Details
Closed on
Aug 1, 1983
Bought by
P and R
Purchase Details
Closed on
Jun 12, 1975
Bought by
N R S Properties Inc
Create a Home Valuation Report for This Property
The Home Valuation Report is an in-depth analysis detailing your home's value as well as a comparison with similar homes in the area
Home Values in the Area
Average Home Value in this Area
Purchase History
| Date | Buyer | Sale Price | Title Company |
|---|---|---|---|
| Ware Richard L | -- | -- | |
| Ware Richard L | $118,000 | -- | |
| Goff Rita F | -- | -- | |
| Goff James H | $85,000 | -- | |
| Bramonte John S | $70,000 | -- | |
| Highfield Terry Ann | $12,000 | -- | |
| Casey J W | -- | -- | |
| P | $11,000 | -- | |
| N R S Properties Inc | -- | -- |
Source: Public Records
Tax History Compared to Growth
Tax History
| Year | Tax Paid | Tax Assessment Tax Assessment Total Assessment is a certain percentage of the fair market value that is determined by local assessors to be the total taxable value of land and additions on the property. | Land | Improvement |
|---|---|---|---|---|
| 2024 | $2,832 | $95,114 | $13,551 | $81,563 |
| 2023 | $2,189 | $87,430 | $11,957 | $75,473 |
| 2022 | $1,876 | $72,823 | $9,566 | $63,257 |
| 2021 | $1,799 | $67,062 | $9,566 | $57,496 |
| 2020 | $1,658 | $58,889 | $7,573 | $51,316 |
| 2019 | $1,528 | $53,007 | $7,573 | $45,434 |
| 2018 | $1,483 | $50,543 | $7,573 | $42,970 |
| 2017 | $1,410 | $47,751 | $7,573 | $40,178 |
| 2016 | $1,328 | $44,480 | $5,000 | $39,480 |
| 2015 | $1,329 | $45,336 | $5,000 | $40,336 |
| 2014 | $1,329 | $45,336 | $5,000 | $40,336 |
Source: Public Records
Map
Nearby Homes
- 0 Warwick Way SE Unit 10624495
- 0 Warwick Way SE Unit 7666193
- 18 Devonshire Dr SE
- 111 Warwick Way SE
- 113 Warwick Way SE
- 85 Cambridge Dr SE
- 11 Cambridge Dr SE
- 0 Camelot Cir SE Unit 7662985
- 0 Camelot Cir SE Unit 10621392
- 7 Rushden Way SE
- 3 Rushden Way SE
- 0 Wellington Way SE Unit 7374602
- 0 Wellington Way SE Unit 20180068
- 0 Wellington Way SE Unit 7374604
- 0 Wellington Way SE Unit 20180069
- 28 Rushden Way SE
- 30 Rushden Way SE
- 52 Twickenham Rd SE
- 9 Wellington Way SE
- 14 Wellington Way SE
- 15 Warwick Way SE Unit 48
- 19 London Ln SE
- 21 London Ln SE
- 11 Warwick Way SE Unit 46
- 17 London Ln SE
- 19 Warwick Way SE
- 12 Dover Dr SE
- 21 Warwick Way SE
- 23 London Ln SE
- 15 London Ln SE
- 12 Warwick Way SE
- 0 Dover Dr SE Unit 8465154
- 0 Dover Dr SE
- 10 Dover Dr SE
- 13 London Ln SE
- 7 Canterbury Ct SE Unit Studio Apartment
- 7 Canterbury Ct SE
- 20 London Ln SE
- 0 Warwick Way SE Unit 6025210
- 0 Warwick Way SE Unit 17 8395922