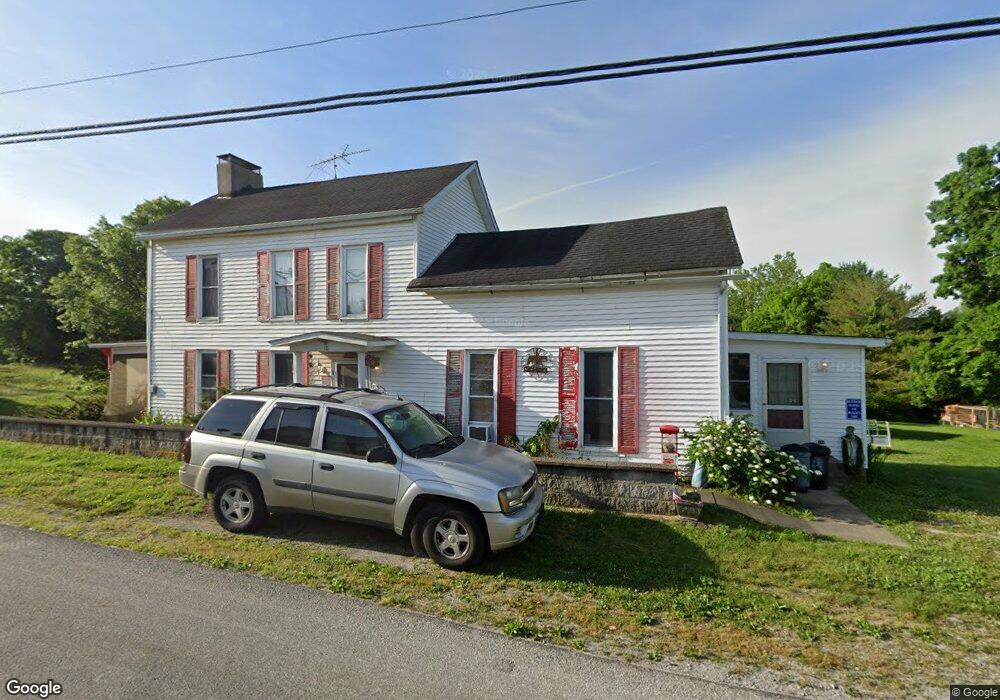
18 Water St Sinking Spring, OH 45172
Estimated Value: $81,000 - $190,000
4
Beds
3
Baths
2,135
Sq Ft
$61/Sq Ft
Est. Value
About This Home
This home is located at 18 Water St, Sinking Spring, OH 45172 and is currently estimated at $129,387, approximately $60 per square foot. 18 Water St is a home located in Highland County with nearby schools including Peebles Elementary School and Peebles High School.
Ownership History
Date
Name
Owned For
Owner Type
Purchase Details
Closed on
Mar 22, 2023
Sold by
Davis Sharon
Bought by
Davis Sean S
Current Estimated Value
Purchase Details
Closed on
Jul 28, 2011
Sold by
Secretary Of Housing & Urban Development
Bought by
Davis Sharon
Purchase Details
Closed on
Dec 7, 2010
Sold by
Wells Fargo Bank Na
Bought by
Secretary Of Housing & Urban Development
Purchase Details
Closed on
Aug 12, 2010
Sold by
Burton Michael Jerry
Bought by
Wells Fargo Bank Na
Purchase Details
Closed on
Nov 14, 2001
Sold by
Roberts Gregory D
Bought by
Burton Michael J
Home Financials for this Owner
Home Financials are based on the most recent Mortgage that was taken out on this home.
Original Mortgage
$72,471
Interest Rate
6.69%
Mortgage Type
FHA
Purchase Details
Closed on
Mar 24, 1997
Sold by
Hopkins Daniel
Bought by
Roberts Gregory and Roberts Diane
Purchase Details
Closed on
Jan 1, 1990
Bought by
Fields Roy and Fields Lynda S
Create a Home Valuation Report for This Property
The Home Valuation Report is an in-depth analysis detailing your home's value as well as a comparison with similar homes in the area
Purchase History
| Date | Buyer | Sale Price | Title Company |
|---|---|---|---|
| Davis Sean S | $166 | None Listed On Document | |
| Davis Sean S | $166 | None Listed On Document | |
| Davis Sharon | $20,000 | Attorney | |
| Secretary Of Housing & Urban Development | -- | None Available | |
| Wells Fargo Bank Na | $84,548 | None Available | |
| Burton Michael J | $73,650 | -- | |
| Roberts Gregory | $56,000 | -- | |
| Fields Roy | -- | -- |
Source: Public Records
Mortgage History
| Date | Status | Borrower | Loan Amount |
|---|---|---|---|
| Previous Owner | Burton Michael J | $72,471 |
Source: Public Records
Tax History
| Year | Tax Paid | Tax Assessment Tax Assessment Total Assessment is a certain percentage of the fair market value that is determined by local assessors to be the total taxable value of land and additions on the property. | Land | Improvement |
|---|---|---|---|---|
| 2024 | $531 | $15,270 | $5,780 | $9,490 |
| 2023 | $532 | $12,640 | $4,870 | $7,770 |
| 2022 | $367 | $10,090 | $4,870 | $5,220 |
| 2021 | $394 | $10,090 | $4,870 | $5,220 |
| 2020 | $381 | $9,140 | $4,410 | $4,730 |
| 2019 | $376 | $9,140 | $4,410 | $4,730 |
| 2018 | $769 | $18,550 | $4,410 | $14,140 |
| 2017 | $336 | $8,020 | $3,570 | $4,450 |
| 2016 | $335 | $8,020 | $3,570 | $4,450 |
| 2015 | $335 | $8,020 | $3,570 | $4,450 |
| 2014 | $329 | $7,640 | $3,400 | $4,240 |
| 2013 | $333 | $7,640 | $3,400 | $4,240 |
Source: Public Records
Map
Nearby Homes
- 9 Sugar St
- 104 Main St
- 11615 Sinking Springs Rd
- 13731 Saw Mill Rd
- 1056 Nace Corner Rd
- 11615 Sinking Spring Rd
- 2090 Dutch Thomas Rd
- 664 Strait Creek Rd
- 41 Acres Sr 41
- 3750 Ohio 124
- 1646 Bell Hollow Rd
- 6075 Ohio 73
- 1 Seaman Rd
- 1459 Ohio 73
- 0 Harriett Rd Unit 1865983
- 234 Drybone Rd
- 5396 Ohio 753
- 250 Poplar Grove Rd
- 135 Union Hill Rd
- 10955 E Prospect Rd
Your Personal Tour Guide
Ask me questions while you tour the home.