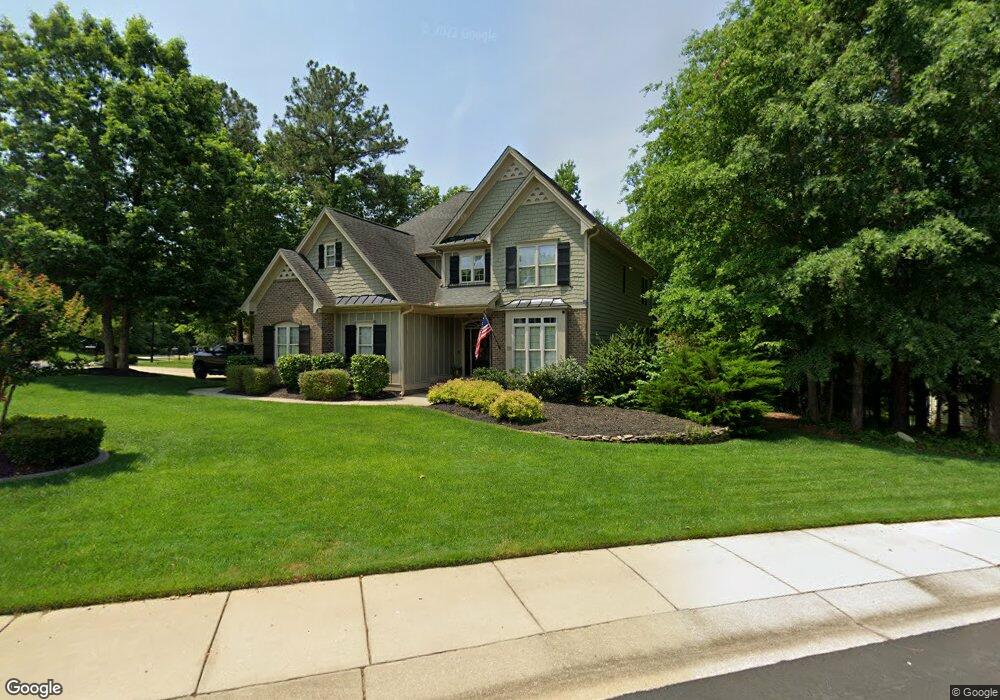
18 Watrus Dr Unit Lt47 Clayton, NC 27527
Wilders NeighborhoodEstimated Value: $613,180 - $748,000
4
Beds
3
Baths
2,769
Sq Ft
$239/Sq Ft
Est. Value
About This Home
This home is located at 18 Watrus Dr Unit Lt47, Clayton, NC 27527 and is currently estimated at $662,795, approximately $239 per square foot. 18 Watrus Dr Unit Lt47 is a home located in Johnston County with nearby schools including River Dell Elementary School, Archer Lodge Middle School, and Corinth Holders High School.
Ownership History
Date
Name
Owned For
Owner Type
Purchase Details
Closed on
Sep 21, 2016
Sold by
Wilcox Gregory B and Wilcox Melodie B
Bought by
Alexander Mark E and Alexander Beverly B
Current Estimated Value
Home Financials for this Owner
Home Financials are based on the most recent Mortgage that was taken out on this home.
Original Mortgage
$393,000
Outstanding Balance
$321,978
Interest Rate
3.45%
Mortgage Type
VA
Estimated Equity
$340,817
Purchase Details
Closed on
Sep 18, 2008
Sold by
Emk Construction Inc
Bought by
Wilcox Gregory B and Wilcox Melodie B
Home Financials for this Owner
Home Financials are based on the most recent Mortgage that was taken out on this home.
Original Mortgage
$340,000
Interest Rate
6.45%
Mortgage Type
Purchase Money Mortgage
Purchase Details
Closed on
Jan 2, 2007
Sold by
Dwf Development Inc
Bought by
Emk Construction Inc
Create a Home Valuation Report for This Property
The Home Valuation Report is an in-depth analysis detailing your home's value as well as a comparison with similar homes in the area
Home Values in the Area
Average Home Value in this Area
Purchase History
| Date | Buyer | Sale Price | Title Company |
|---|---|---|---|
| Alexander Mark E | $393,000 | Morehead Title Company | |
| Wilcox Gregory B | $378,000 | None Available | |
| Emk Construction Inc | $130,000 | Blackacre |
Source: Public Records
Mortgage History
| Date | Status | Borrower | Loan Amount |
|---|---|---|---|
| Open | Alexander Mark E | $393,000 | |
| Previous Owner | Wilcox Gregory B | $340,000 |
Source: Public Records
Tax History Compared to Growth
Tax History
| Year | Tax Paid | Tax Assessment Tax Assessment Total Assessment is a certain percentage of the fair market value that is determined by local assessors to be the total taxable value of land and additions on the property. | Land | Improvement |
|---|---|---|---|---|
| 2025 | $4,002 | $587,770 | $110,000 | $477,770 |
| 2024 | $3,437 | $375,720 | $65,000 | $310,720 |
| 2023 | $3,049 | $375,720 | $65,000 | $310,720 |
| 2022 | $3,088 | $375,720 | $65,000 | $310,720 |
| 2021 | $3,089 | $375,720 | $65,000 | $310,720 |
| 2020 | $3,203 | $375,720 | $65,000 | $310,720 |
| 2019 | $3,205 | $375,720 | $65,000 | $310,720 |
| 2018 | $3,335 | $383,380 | $65,000 | $318,380 |
| 2017 | $3,335 | $383,380 | $65,000 | $318,380 |
| 2016 | $3,335 | $383,380 | $65,000 | $318,380 |
| 2015 | -- | $383,380 | $65,000 | $318,380 |
| 2014 | -- | $383,380 | $65,000 | $318,380 |
Source: Public Records
Map
Nearby Homes
- 81 Syracuse Dr
- 135 Flowers Pkwy
- 256 Running Springs Ct
- 113 Somers Ln
- 206 Running Springs Ct
- 115 SW Flowers Pkwy
- 88 White Pine Dr
- 191 SW Flowers Pkwy
- 47 White Pine Dr
- 15 Drayton St
- 65 Oglethorpe Ave
- 681 Rockport Dr
- 46 Woods Manor Ln
- 225 Beckwith Ave
- 96 Periwinkle Place
- 163 Periwinkle Place
- 109 Periwinkle Place
- 72 Little Leaf Ln
- 91 Little Leaf Ln Unit 103
- 85 Little Leaf Ln
- 18 Watrus Dr
- 42 Watrus Dr
- 42 Watrus Dr Unit 46
- 0 Josiah Dr Unit 994633
- 0 Josiah Dr Unit 994671
- 0 Josiah Dr Unit 58 TR994633
- 0 Josiah Dr Unit 48 994671
- 258 Josiah Dr Unit 63
- 258 Josiah Dr
- 124 Josiah Dr
- 124 Josiah Dr Unit 48
- 167 Josiah Dr
- 167 Josiah Dr Unit 52
- 150 Josiah Dr
- 150 Josiah Dr Unit Lt67
- 85 Josiah Dr
- 85 Josiah Dr Unit 2
- 80 Watrus Dr Unit 45
- 80 Watrus Dr
- 96 Josiah Dr