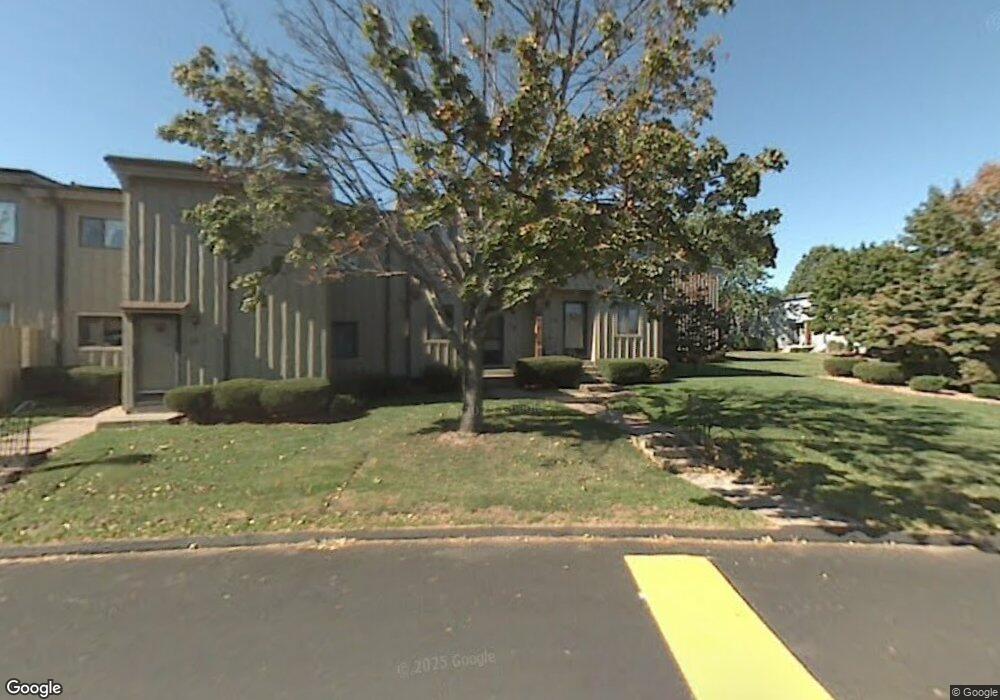
18 Webster Ct Newington, CT 06111
Estimated Value: $242,000 - $251,000
2
Beds
2
Baths
1,096
Sq Ft
$223/Sq Ft
Est. Value
About This Home
This home is located at 18 Webster Ct, Newington, CT 06111 and is currently estimated at $244,317, approximately $222 per square foot. 18 Webster Ct is a home located in Hartford County with nearby schools including John Paterson School, John Wallace Middle School, and Newington High School.
Ownership History
Date
Name
Owned For
Owner Type
Purchase Details
Closed on
May 19, 2020
Sold by
Agolli Vanista
Bought by
Greene Brian R
Current Estimated Value
Home Financials for this Owner
Home Financials are based on the most recent Mortgage that was taken out on this home.
Original Mortgage
$127,300
Outstanding Balance
$112,558
Interest Rate
3.3%
Mortgage Type
New Conventional
Estimated Equity
$131,759
Purchase Details
Closed on
Aug 8, 2012
Sold by
Bennett Carolina I
Bought by
Agolli Vanista
Home Financials for this Owner
Home Financials are based on the most recent Mortgage that was taken out on this home.
Original Mortgage
$96,000
Interest Rate
3.7%
Purchase Details
Closed on
Jul 28, 2003
Sold by
Cullina Donna M
Bought by
Wertenbach Carolina I
Home Financials for this Owner
Home Financials are based on the most recent Mortgage that was taken out on this home.
Original Mortgage
$98,800
Interest Rate
5.27%
Create a Home Valuation Report for This Property
The Home Valuation Report is an in-depth analysis detailing your home's value as well as a comparison with similar homes in the area
Home Values in the Area
Average Home Value in this Area
Purchase History
| Date | Buyer | Sale Price | Title Company |
|---|---|---|---|
| Greene Brian R | $134,000 | None Available | |
| Agolli Vanista | $120,000 | -- | |
| Wertenbach Carolina I | $123,500 | -- |
Source: Public Records
Mortgage History
| Date | Status | Borrower | Loan Amount |
|---|---|---|---|
| Open | Greene Brian R | $127,300 | |
| Previous Owner | Agolli Vanista | $96,000 | |
| Previous Owner | Wertenbach Carolina I | $98,800 |
Source: Public Records
Tax History
| Year | Tax Paid | Tax Assessment Tax Assessment Total Assessment is a certain percentage of the fair market value that is determined by local assessors to be the total taxable value of land and additions on the property. | Land | Improvement |
|---|---|---|---|---|
| 2025 | $3,315 | $82,920 | $0 | $82,920 |
| 2024 | $3,686 | $92,910 | $0 | $92,910 |
| 2023 | $3,564 | $92,910 | $0 | $92,910 |
| 2022 | $3,576 | $92,910 | $0 | $92,910 |
| 2021 | $3,606 | $92,910 | $0 | $92,910 |
| 2020 | $3,776 | $96,130 | $0 | $96,130 |
| 2019 | $3,792 | $96,130 | $0 | $96,130 |
| 2018 | $3,701 | $96,130 | $0 | $96,130 |
| 2017 | $3,517 | $96,130 | $0 | $96,130 |
| 2016 | $3,437 | $96,130 | $0 | $96,130 |
| 2014 | $2,970 | $85,420 | $0 | $85,420 |
Source: Public Records
Map
Nearby Homes
- 129 Webster Ct
- 660/674 Church Rear St
- 32 Lexington Cir
- 2990 Berlin Turnpike
- 2950 Berlin Turnpike
- 212 Church St
- 70 Foster St
- 312 Foxboro Dr Unit 312
- 261 Foxboro Dr
- 1471 Willard Ave Unit C
- 0 Country Ct Unit 137 24077628
- 634 New Britain Ave
- 172 Eddy Ln
- 35 Woodsedge Dr Unit 4C
- 163 Speno Ridge
- 18 Stone Hill Dr
- 144 Churchill Dr
- 17 Mulberry Ct
- 417 Churchill Dr Unit 417
- 11 Eleanor Place
- 18 Webster Ct Unit 18
- 19 Webster Ct
- 16 Webster Ct
- 17 Webster Ct
- 17 Webster Ct Unit 17
- 20 Webster Ct
- 20 Webster Ct Unit 20
- 21 Webster Ct
- 14 Webster Ct
- 22 Webster Ct Unit 22
- 15 Webster Ct
- 23 Webster Ct
- 23 Webster Ct Unit 23
- 24 Webster Ct
- 25 Webster Ct
- 139 Webster Ct
- 140 Webster Ct
- 135 Webster Ct
- 135 Webster Ct Unit 135
- 28 Webster Ct