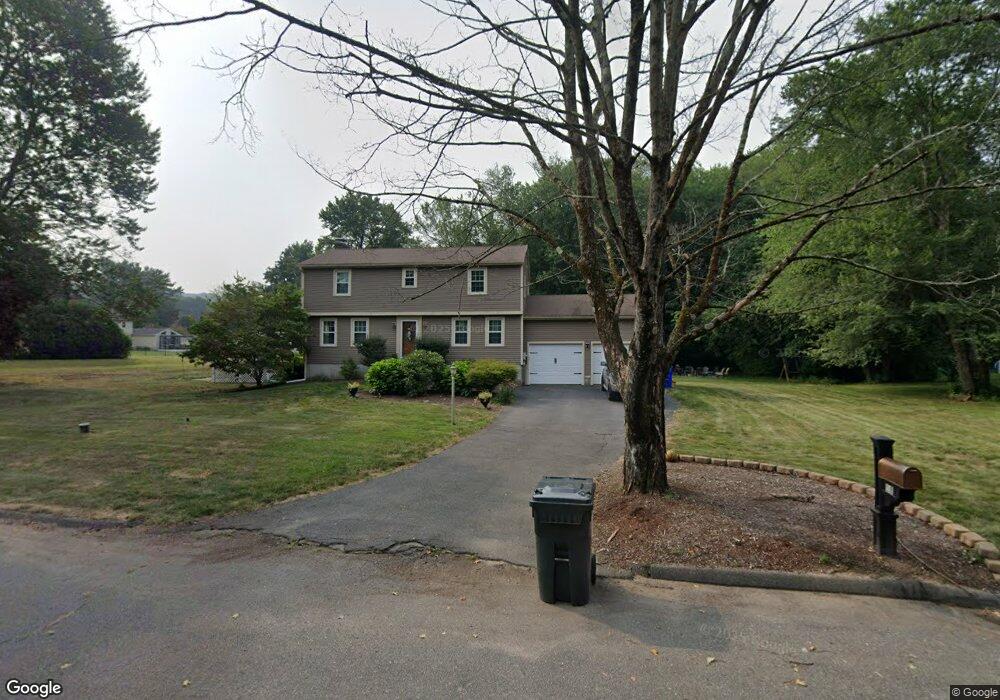
18 Westernview Dr Wilbraham, MA 01095
Estimated Value: $458,000 - $573,000
4
Beds
3
Baths
1,862
Sq Ft
$275/Sq Ft
Est. Value
About This Home
This home is located at 18 Westernview Dr, Wilbraham, MA 01095 and is currently estimated at $512,089, approximately $275 per square foot. 18 Westernview Dr is a home located in Hampden County with nearby schools including Minnechaug Regional High School and Wilbraham & Monson Academy.
Ownership History
Date
Name
Owned For
Owner Type
Purchase Details
Closed on
Aug 1, 2006
Sold by
Mclaren James T and Mclaren Pamela S
Bought by
Beebe Carol J and Beebe James M
Current Estimated Value
Home Financials for this Owner
Home Financials are based on the most recent Mortgage that was taken out on this home.
Original Mortgage
$255,920
Interest Rate
6.67%
Mortgage Type
Purchase Money Mortgage
Purchase Details
Closed on
Apr 24, 1987
Sold by
Campagna C Thomas
Bought by
Mclaren James T
Create a Home Valuation Report for This Property
The Home Valuation Report is an in-depth analysis detailing your home's value as well as a comparison with similar homes in the area
Home Values in the Area
Average Home Value in this Area
Purchase History
| Date | Buyer | Sale Price | Title Company |
|---|---|---|---|
| Beebe Carol J | $319,900 | -- | |
| Mclaren James T | $178,000 | -- |
Source: Public Records
Mortgage History
| Date | Status | Borrower | Loan Amount |
|---|---|---|---|
| Open | Mclaren James T | $310,500 | |
| Closed | Beebe Carol J | $255,920 | |
| Closed | Beebe Carol J | $63,900 | |
| Previous Owner | Mclaren James T | $115,500 | |
| Previous Owner | Mclaren James T | $30,000 |
Source: Public Records
Tax History
| Year | Tax Paid | Tax Assessment Tax Assessment Total Assessment is a certain percentage of the fair market value that is determined by local assessors to be the total taxable value of land and additions on the property. | Land | Improvement |
|---|---|---|---|---|
| 2025 | $7,488 | $418,800 | $102,000 | $316,800 |
| 2024 | $7,400 | $400,000 | $102,000 | $298,000 |
| 2023 | $6,772 | $365,300 | $102,000 | $263,300 |
| 2022 | $6,772 | $330,500 | $102,000 | $228,500 |
| 2021 | $6,578 | $286,500 | $109,800 | $176,700 |
| 2020 | $6,412 | $286,500 | $109,800 | $176,700 |
| 2019 | $6,246 | $286,500 | $109,800 | $176,700 |
| 2018 | $6,251 | $276,100 | $109,800 | $166,300 |
| 2017 | $6,074 | $276,100 | $109,800 | $166,300 |
| 2016 | $6,134 | $284,000 | $116,300 | $167,700 |
| 2015 | $5,930 | $284,000 | $116,300 | $167,700 |
Source: Public Records
Map
Nearby Homes
- 59 Baldwin Dr
- 85 Baldwin Dr
- 107 Baldwin Dr
- 6 Katie St
- 230V Burleigh Rd
- 24 Mcintosh Dr
- 46 Holland Dr
- 16 Deerfoot Dr
- 208 Tamarack Dr
- 25 Winding Brook Ln
- 0 Mountain Rd Unit 73267162
- 0 Mountain Rd Unit 72942534
- 72 Tanglewood Dr
- 25 Angelica Dr
- 5 Northwood Dr
- 55 Allen St
- 301 Tinkham Rd
- 6 Hilltop Park
- 17 Skyridge Ln
- 6 Brooklawn Rd
Your Personal Tour Guide
Ask me questions while you tour the home.