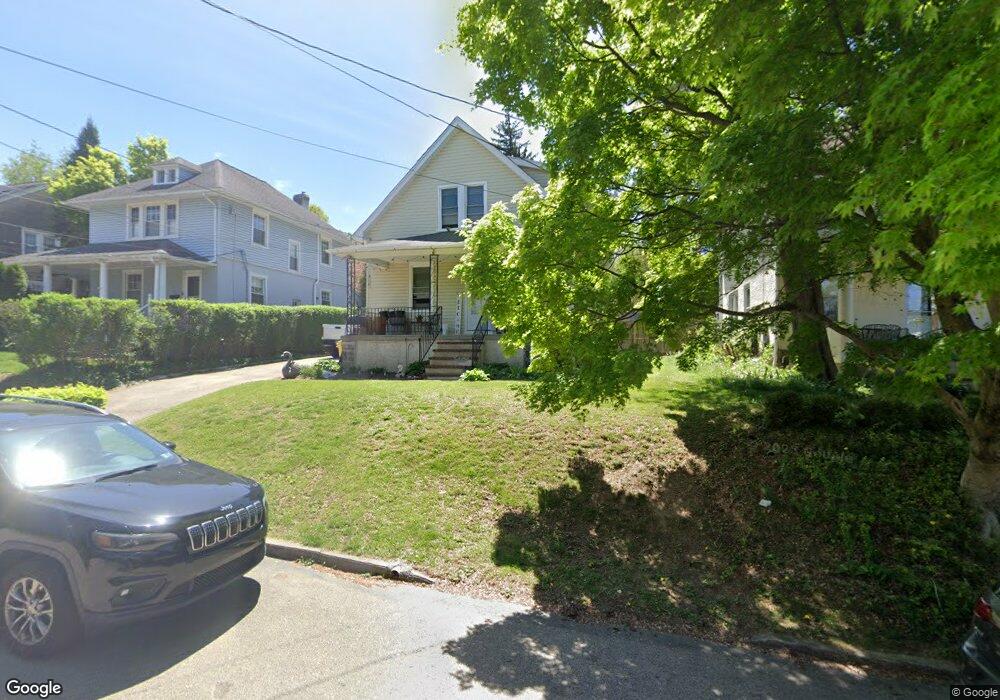
18 Whitemarsh Ave Glenside, PA 19038
Estimated Value: $440,000 - $483,795
3
Beds
2
Baths
1,320
Sq Ft
$351/Sq Ft
Est. Value
About This Home
This home is located at 18 Whitemarsh Ave, Glenside, PA 19038 and is currently estimated at $463,449, approximately $351 per square foot. 18 Whitemarsh Ave is a home located in Montgomery County with nearby schools including Erdenheim Elementary School, Enfield Elementary School, and Springfield Township Middle School.
Ownership History
Date
Name
Owned For
Owner Type
Purchase Details
Closed on
Apr 27, 2021
Sold by
Mcelroy Laura A and Mcelroy Larry
Bought by
Mcelroy Laura A
Current Estimated Value
Home Financials for this Owner
Home Financials are based on the most recent Mortgage that was taken out on this home.
Original Mortgage
$269,500
Outstanding Balance
$243,467
Interest Rate
2.9%
Mortgage Type
New Conventional
Estimated Equity
$219,982
Purchase Details
Closed on
Mar 18, 2004
Sold by
Sacco Laura A and Mcelroy Laura A
Bought by
Mcelroy Laura A and Mcelroy Larry
Home Financials for this Owner
Home Financials are based on the most recent Mortgage that was taken out on this home.
Original Mortgage
$192,000
Interest Rate
5.56%
Purchase Details
Closed on
Jan 11, 2004
Sold by
Sacco Laura A
Bought by
Mcelroy Larry P and Mcelroy Laura A
Purchase Details
Closed on
Apr 3, 1998
Sold by
Seeds Frances E and Mcmenamin Margaret M
Bought by
Sacco Laura A
Create a Home Valuation Report for This Property
The Home Valuation Report is an in-depth analysis detailing your home's value as well as a comparison with similar homes in the area
Home Values in the Area
Average Home Value in this Area
Purchase History
| Date | Buyer | Sale Price | Title Company |
|---|---|---|---|
| Mcelroy Laura A | -- | None Available | |
| Mcelroy Laura A | -- | First American Title Ins Co | |
| Mcelroy Larry P | -- | -- | |
| Sacco Laura A | $130,000 | -- |
Source: Public Records
Mortgage History
| Date | Status | Borrower | Loan Amount |
|---|---|---|---|
| Open | Mcelroy Laura A | $269,500 | |
| Closed | Mcelroy Laura A | $192,000 |
Source: Public Records
Tax History Compared to Growth
Tax History
| Year | Tax Paid | Tax Assessment Tax Assessment Total Assessment is a certain percentage of the fair market value that is determined by local assessors to be the total taxable value of land and additions on the property. | Land | Improvement |
|---|---|---|---|---|
| 2025 | $6,056 | $128,560 | $46,000 | $82,560 |
| 2024 | $6,056 | $128,560 | $46,000 | $82,560 |
| 2023 | $5,845 | $128,560 | $46,000 | $82,560 |
| 2022 | $5,677 | $128,560 | $46,000 | $82,560 |
| 2021 | $5,529 | $128,560 | $46,000 | $82,560 |
| 2020 | $5,400 | $128,560 | $46,000 | $82,560 |
| 2019 | $5,317 | $128,560 | $46,000 | $82,560 |
| 2018 | $5,317 | $128,560 | $46,000 | $82,560 |
| 2017 | $5,075 | $128,560 | $46,000 | $82,560 |
| 2016 | $5,026 | $128,560 | $46,000 | $82,560 |
| 2015 | $4,777 | $128,560 | $46,000 | $82,560 |
| 2014 | $4,777 | $128,560 | $46,000 | $82,560 |
Source: Public Records
Map
Nearby Homes
- 9402 Meadowbrook Ave
- 200 Hillcrest Ave
- 118 E Hillcrest Ave
- 180 Hillcrest Ave
- 106 Montgomery Ave
- 5 Erdenheim Rd
- 104 E Bells Mill Rd
- 8720 Prospect Ave
- 402 Longfield Rd
- 21 Franklin Ave
- 116 E Chestnut Hill Ave
- 8708 Prospect Ave Unit B4
- 124 E Chestnut Hill Ave
- 21 Jones Ave
- 32 Jones Ave
- 1104 Cromwell Rd
- 8408 Prospect Ave
- 303 Glenway Rd
- 8610 Evergreen Place Unit 100
- 8610 Evergreen Place Unit 201
- 16 Whitemarsh Ave
- 20 Whitemarsh Ave
- 14 Whitemarsh Ave
- 22 Whitemarsh Ave
- 12 Whitemarsh Ave
- 9405 Stenton Ave
- 10 Whitemarsh Ave
- 9407 Stenton Ave
- 9403 Stenton Ave
- 19 Whitemarsh Ave
- 17 Whitemarsh Ave
- 21 Whitemarsh Ave
- 15 Whitemarsh Ave
- 11 1/2 Whitemarsh Ave
- 11 1/2 Whitemarsh Ave Unit 2
- 11 1/2 Whitemarsh Ave Unit B
- 11 1/2 Whitemarsh Ave Unit A
- 9409 Stenton Ave
- 8 Whitemarsh Ave
- 28 Whitemarsh Ave