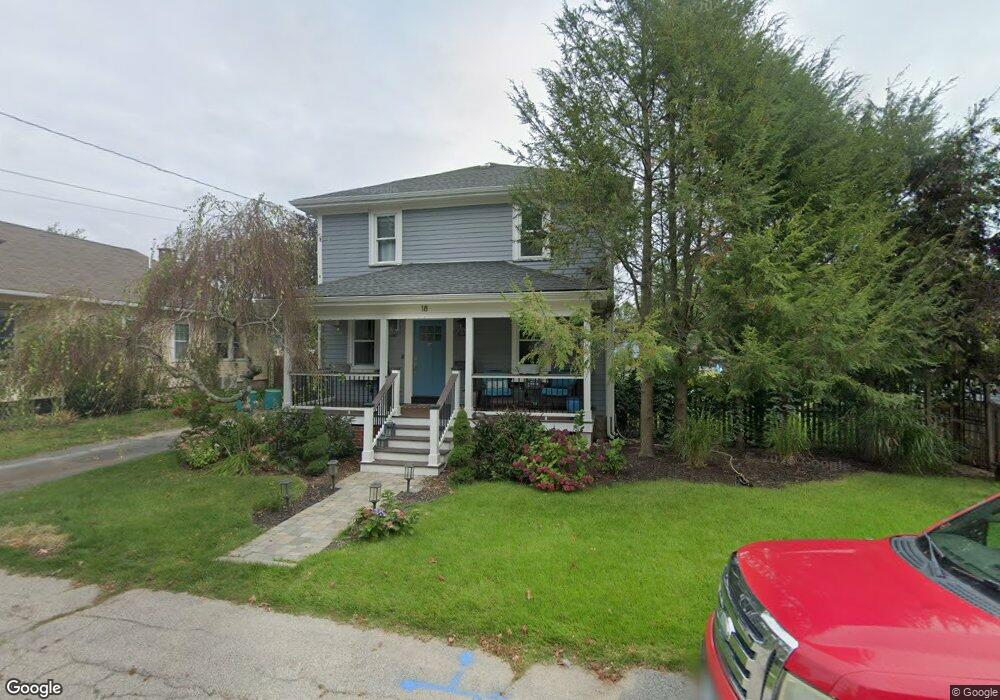
18 Whitin Ave Warwick, RI 02888
Palace Garden NeighborhoodEstimated Value: $419,115 - $480,000
4
Beds
1
Bath
1,664
Sq Ft
$268/Sq Ft
Est. Value
About This Home
This home is located at 18 Whitin Ave, Warwick, RI 02888 and is currently estimated at $446,029, approximately $268 per square foot. 18 Whitin Ave is a home located in Kent County with nearby schools including St. Peter School and Saint Paul School.
Ownership History
Date
Name
Owned For
Owner Type
Purchase Details
Closed on
Dec 29, 1998
Sold by
Torchia Richard R and Torchia Deborah A
Bought by
Bianco Linda M
Current Estimated Value
Home Financials for this Owner
Home Financials are based on the most recent Mortgage that was taken out on this home.
Original Mortgage
$88,000
Interest Rate
6.89%
Mortgage Type
Purchase Money Mortgage
Purchase Details
Closed on
Feb 3, 1989
Sold by
Mclellan James
Bought by
Torchia Richard R
Home Financials for this Owner
Home Financials are based on the most recent Mortgage that was taken out on this home.
Original Mortgage
$104,007
Interest Rate
10.62%
Mortgage Type
Purchase Money Mortgage
Create a Home Valuation Report for This Property
The Home Valuation Report is an in-depth analysis detailing your home's value as well as a comparison with similar homes in the area
Home Values in the Area
Average Home Value in this Area
Purchase History
| Date | Buyer | Sale Price | Title Company |
|---|---|---|---|
| Bianco Linda M | $110,000 | -- | |
| Torchia Richard R | $103,000 | -- | |
| Torchia Richard R | $103,000 | -- |
Source: Public Records
Mortgage History
| Date | Status | Borrower | Loan Amount |
|---|---|---|---|
| Open | Torchia Richard R | $150,000 | |
| Closed | Torchia Richard R | $88,000 | |
| Previous Owner | Torchia Richard R | $104,007 |
Source: Public Records
Tax History Compared to Growth
Tax History
| Year | Tax Paid | Tax Assessment Tax Assessment Total Assessment is a certain percentage of the fair market value that is determined by local assessors to be the total taxable value of land and additions on the property. | Land | Improvement |
|---|---|---|---|---|
| 2025 | $4,729 | $372,400 | $132,700 | $239,700 |
| 2024 | $4,523 | $312,600 | $115,400 | $197,200 |
| 2023 | $4,436 | $312,600 | $115,400 | $197,200 |
| 2022 | $4,250 | $226,900 | $75,000 | $151,900 |
| 2021 | $3,613 | $192,900 | $75,000 | $117,900 |
| 2020 | $3,613 | $192,900 | $75,000 | $117,900 |
| 2019 | $3,613 | $192,900 | $75,000 | $117,900 |
| 2018 | $3,496 | $168,100 | $75,000 | $93,100 |
| 2017 | $3,402 | $168,100 | $75,000 | $93,100 |
| 2016 | $3,402 | $168,100 | $75,000 | $93,100 |
| 2015 | $3,050 | $147,000 | $58,000 | $89,000 |
| 2014 | $2,949 | $147,000 | $58,000 | $89,000 |
| 2013 | $2,909 | $147,000 | $58,000 | $89,000 |
Source: Public Records
Map
Nearby Homes
- 345 Post Rd
- 114 Jefferson St
- 92 Washington St
- 170 Holmes Rd
- 259 Holmes Rd
- 200 Post Rd Unit 411
- 200 Post Rd Unit 603
- 95 Roosevelt St
- 94 Holmes Rd
- 8 Atlantic Ave
- 0 Holmes Rd
- 196 Harrison Ave
- 21 Madison St
- 8 Byron Blvd
- 56 Errol St
- 845 Warwick Ave
- 28 Manchester St
- 55 Longwood Ave
- 19 Remington St
- 31 Longwood Ave