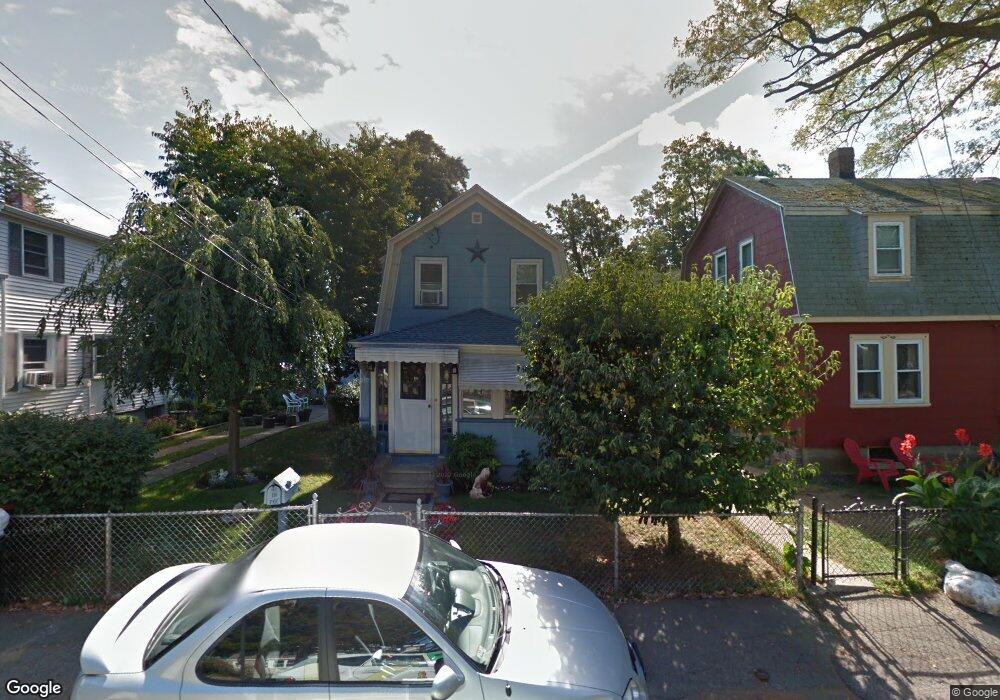
18 Wilgus Rd Quincy, MA 02169
Adams Shore NeighborhoodEstimated Value: $494,000 - $569,000
3
Beds
1
Bath
896
Sq Ft
$586/Sq Ft
Est. Value
About This Home
This home is located at 18 Wilgus Rd, Quincy, MA 02169 and is currently estimated at $524,633, approximately $585 per square foot. 18 Wilgus Rd is a home located in Norfolk County with nearby schools including Snug Harbor Community School, Broad Meadows Middle School, and Quincy High School.
Ownership History
Date
Name
Owned For
Owner Type
Purchase Details
Closed on
Jan 23, 2024
Sold by
Fee Sharon A Est and Redfield
Bought by
Schell Donna and Fee Marian T
Current Estimated Value
Purchase Details
Closed on
Jul 20, 2018
Sold by
Fee Marian A Est
Bought by
Schell Donna M and Fee Marian T
Home Financials for this Owner
Home Financials are based on the most recent Mortgage that was taken out on this home.
Original Mortgage
$154,500
Interest Rate
4.5%
Mortgage Type
New Conventional
Purchase Details
Closed on
Oct 31, 2001
Sold by
Redfield Edward P and Redfield Karen If
Bought by
Fee Marian A
Home Financials for this Owner
Home Financials are based on the most recent Mortgage that was taken out on this home.
Original Mortgage
$137,600
Interest Rate
6.82%
Mortgage Type
Purchase Money Mortgage
Create a Home Valuation Report for This Property
The Home Valuation Report is an in-depth analysis detailing your home's value as well as a comparison with similar homes in the area
Home Values in the Area
Average Home Value in this Area
Purchase History
| Date | Buyer | Sale Price | Title Company |
|---|---|---|---|
| Schell Donna | -- | None Available | |
| Schell Donna | -- | None Available | |
| Schell Donna M | $310,000 | -- | |
| Fee Marian A | $172,000 | -- | |
| Fee Marian A | $172,000 | -- |
Source: Public Records
Mortgage History
| Date | Status | Borrower | Loan Amount |
|---|---|---|---|
| Previous Owner | Schell Donna M | $154,500 | |
| Previous Owner | Fee Marian A | $126,900 | |
| Previous Owner | Fee Marian A | $137,600 |
Source: Public Records
Tax History Compared to Growth
Tax History
| Year | Tax Paid | Tax Assessment Tax Assessment Total Assessment is a certain percentage of the fair market value that is determined by local assessors to be the total taxable value of land and additions on the property. | Land | Improvement |
|---|---|---|---|---|
| 2025 | $4,777 | $414,300 | $214,500 | $199,800 |
| 2024 | $4,586 | $406,900 | $214,500 | $192,400 |
| 2023 | $4,203 | $377,600 | $195,000 | $182,600 |
| 2022 | $3,873 | $323,300 | $150,000 | $173,300 |
| 2021 | $3,357 | $276,500 | $130,400 | $146,100 |
| 2020 | $3,392 | $272,900 | $144,900 | $128,000 |
| 2019 | $3,250 | $259,000 | $133,000 | $126,000 |
| 2018 | $3,214 | $240,900 | $126,600 | $114,300 |
| 2017 | $3,140 | $221,600 | $115,100 | $106,500 |
| 2016 | $3,290 | $229,100 | $127,900 | $101,200 |
| 2015 | $3,060 | $209,600 | $116,300 | $93,300 |
| 2014 | $2,791 | $187,800 | $105,700 | $82,100 |
Source: Public Records
Map
Nearby Homes
- 12 Quentin St
- 10 Forbush Ave
- 599 Sea St
- 599 Sea St Unit 1
- 503 Sea St
- 200 Cove Way Unit 614
- 73 Albatross Rd
- 18 Allerton St
- 7 Manet Ave
- 62 Lawn Ave
- 37 Hobomack Rd
- 585 Washington St Unit model-1
- 585 Washington St Unit model-2
- 585 Washington St Unit model
- 16 Perley Place
- 7-9 Kittredge Ave
- 79 Bicknell St
- 161 Sumner St Unit 2
- 161 Sumner St Unit 4
- 7-11 Lenox St