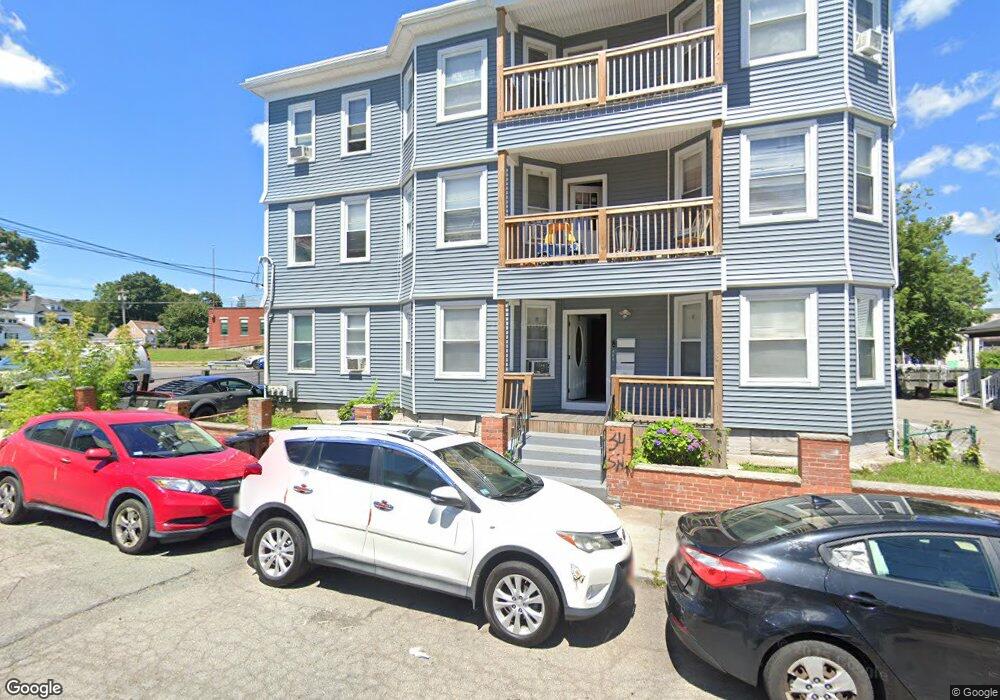
18 Wilmington St Unit 2 Brockton, MA 02301
Montello NeighborhoodEstimated Value: $614,282 - $983,000
4
Beds
1
Bath
1,600
Sq Ft
$480/Sq Ft
Est. Value
About This Home
This home is located at 18 Wilmington St Unit 2, Brockton, MA 02301 and is currently estimated at $767,571, approximately $479 per square foot. 18 Wilmington St Unit 2 is a home located in Plymouth County with nearby schools including Raymond K-8 Elementary School, Louis F Angelo Elementary School, and Manthala George Jr. School.
Ownership History
Date
Name
Owned For
Owner Type
Purchase Details
Closed on
Apr 2, 2003
Sold by
Alves Julia and Depina Daniel
Bought by
Alves Julia
Current Estimated Value
Home Financials for this Owner
Home Financials are based on the most recent Mortgage that was taken out on this home.
Original Mortgage
$256,000
Interest Rate
5.88%
Mortgage Type
Purchase Money Mortgage
Purchase Details
Closed on
Feb 29, 2000
Sold by
Sirois Scott J
Bought by
Vicente Claudina and Alves Julia
Purchase Details
Closed on
Dec 10, 1997
Sold by
Goncalves Gregorio M
Bought by
Sirois Scott J
Purchase Details
Closed on
Mar 1, 1993
Sold by
Fnma
Bought by
Goncalves Gregorio M
Purchase Details
Closed on
Dec 14, 1992
Sold by
Mclaughlin Anthony V
Bought by
Federal National Mortgage Association
Purchase Details
Closed on
Aug 7, 1989
Sold by
Newwquist Valerie
Bought by
Mclaughlin Anthony
Create a Home Valuation Report for This Property
The Home Valuation Report is an in-depth analysis detailing your home's value as well as a comparison with similar homes in the area
Home Values in the Area
Average Home Value in this Area
Purchase History
| Date | Buyer | Sale Price | Title Company |
|---|---|---|---|
| Alves Julia | -- | -- | |
| Vicente Claudina | $165,000 | -- | |
| Sirois Scott J | $112,100 | -- | |
| Goncalves Gregorio M | $13,000 | -- | |
| Federal National Mortgage Association | $202,700 | -- | |
| Mclaughlin Anthony | $199,900 | -- |
Source: Public Records
Mortgage History
| Date | Status | Borrower | Loan Amount |
|---|---|---|---|
| Open | Mclaughlin Anthony | $341,500 | |
| Closed | Mclaughlin Anthony | $256,000 | |
| Previous Owner | Mclaughlin Anthony | $178,500 |
Source: Public Records
Tax History Compared to Growth
Tax History
| Year | Tax Paid | Tax Assessment Tax Assessment Total Assessment is a certain percentage of the fair market value that is determined by local assessors to be the total taxable value of land and additions on the property. | Land | Improvement |
|---|---|---|---|---|
| 2025 | $8,564 | $707,200 | $133,000 | $574,200 |
| 2024 | $8,013 | $666,600 | $133,000 | $533,600 |
| 2023 | $6,877 | $529,800 | $100,200 | $429,600 |
| 2022 | $6,882 | $492,600 | $90,700 | $401,900 |
| 2021 | $6,323 | $436,100 | $74,800 | $361,300 |
| 2020 | $6,101 | $402,700 | $70,900 | $331,800 |
| 2019 | $6,012 | $386,900 | $67,900 | $319,000 |
| 2018 | $5,496 | $342,200 | $67,900 | $274,300 |
| 2017 | $5,229 | $324,800 | $67,900 | $256,900 |
| 2016 | $4,345 | $250,300 | $65,800 | $184,500 |
| 2015 | $3,064 | $168,800 | $65,800 | $103,000 |
| 2014 | $2,923 | $161,200 | $65,800 | $95,400 |
Source: Public Records
Map
Nearby Homes
- 18 Wilmington St
- 24 Wilmington St
- 24 Wilmington St Unit 3
- 21 Howard St Unit 3
- 21 Howard St
- 27 Howard St Unit 2
- 27 Howard St Unit 1
- 25 Howard St
- 25 Howard St Unit 3
- 25 Howard St Unit 2
- 25 Howard St Unit 1
- 19 Howard St
- 19 Howard St Unit 3
- 30 Wilmington St
- 19 Wilmington St
- 25 Wilmington St
- 25 Wilmington St Unit 2
- 29 Howard St Unit 3
- 29 Howard St
- 29 Howard St Unit 4